Stem-and-Leaf Diagrams Math Worksheets
Printable PDF Stem and Leaf Worksheets with Answers
Download our printable stem and leaf diagrams resources to give students the push they need when learning different concepts of statistics equations. Our math experts have specifically curated these resources in a way that your children can master the worksheet using simple sums with clear and easy-to-understand instructions. Hence, our statistics resources are great for building a sense of statistics and geometry and early problem-solving skills.
What Is a Stem and Leaf Diagram?
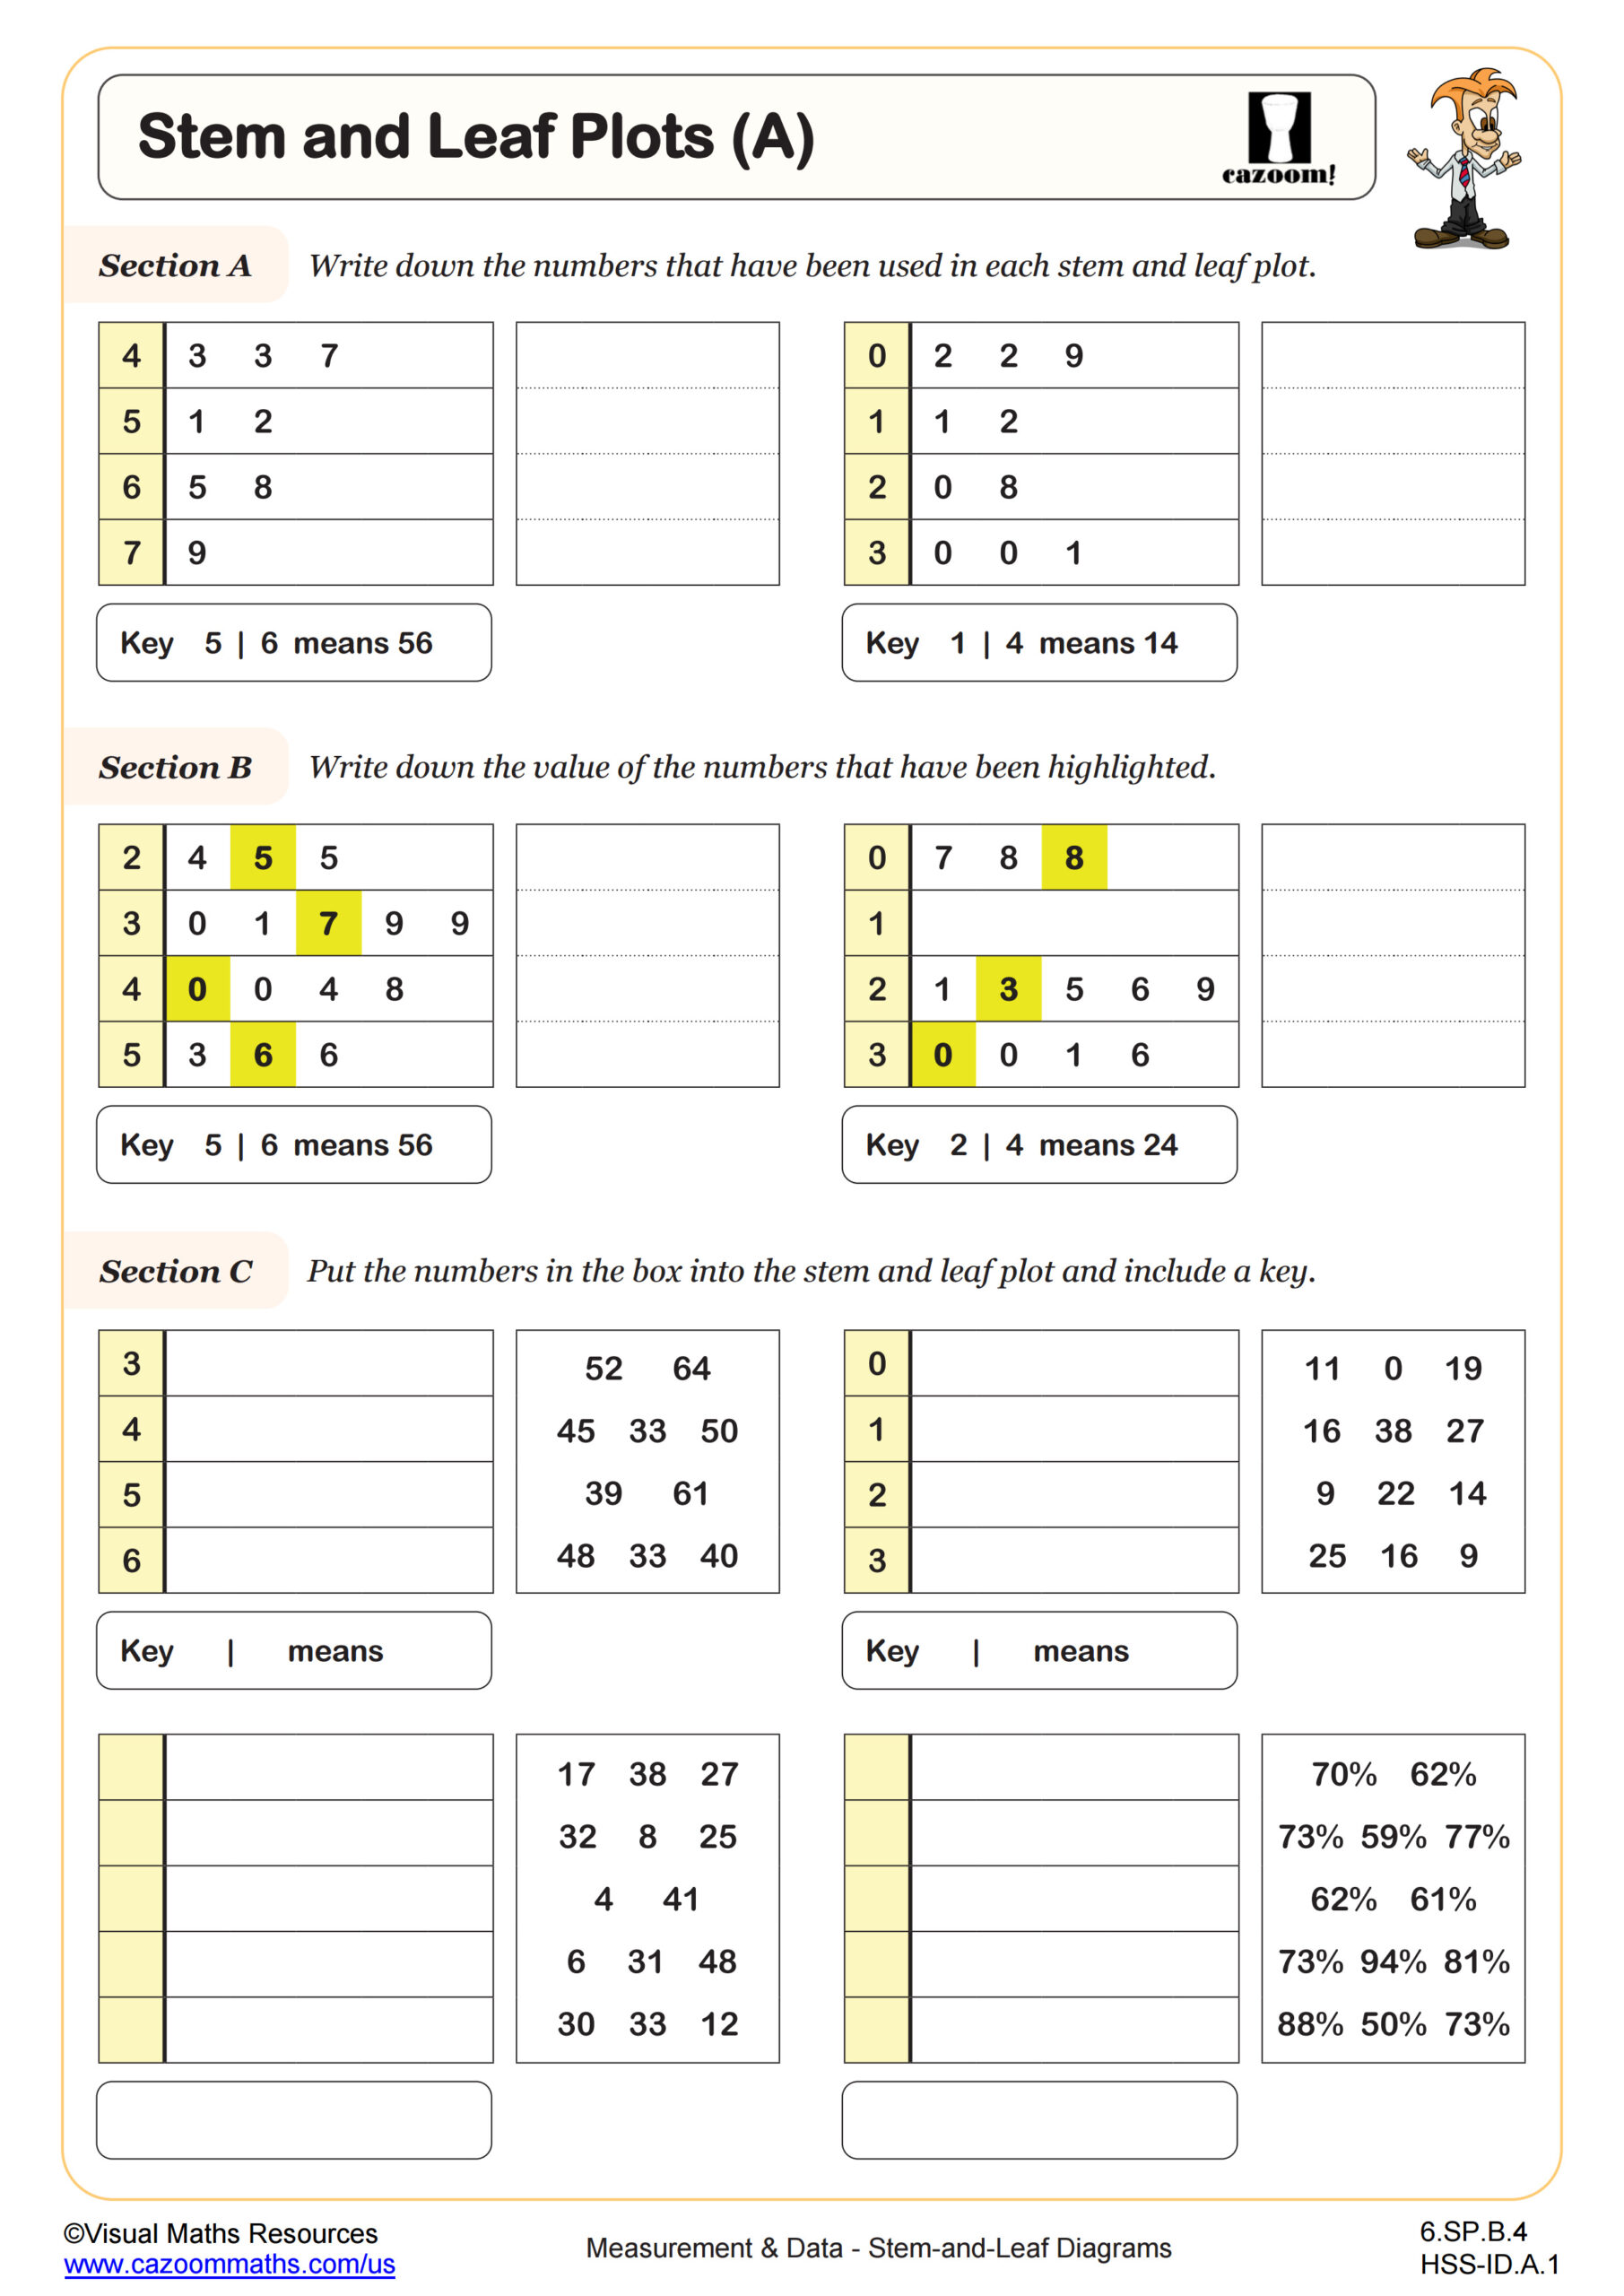
Understanding the core concept of stem and leaf diagrams is an important concept of basic statistics. A stem and leaf diagram is a way to display numerical data in a compact, organized format. The “stem” shows the leading digits (like tens), and the “leaf” shows the final digits (like ones). This method helps students spot patterns, find key values, and quickly compare numbers. It’s especially useful when working with large data sets and supports early statistics and place value learning.
CCSS-Aligned Statistics Practice
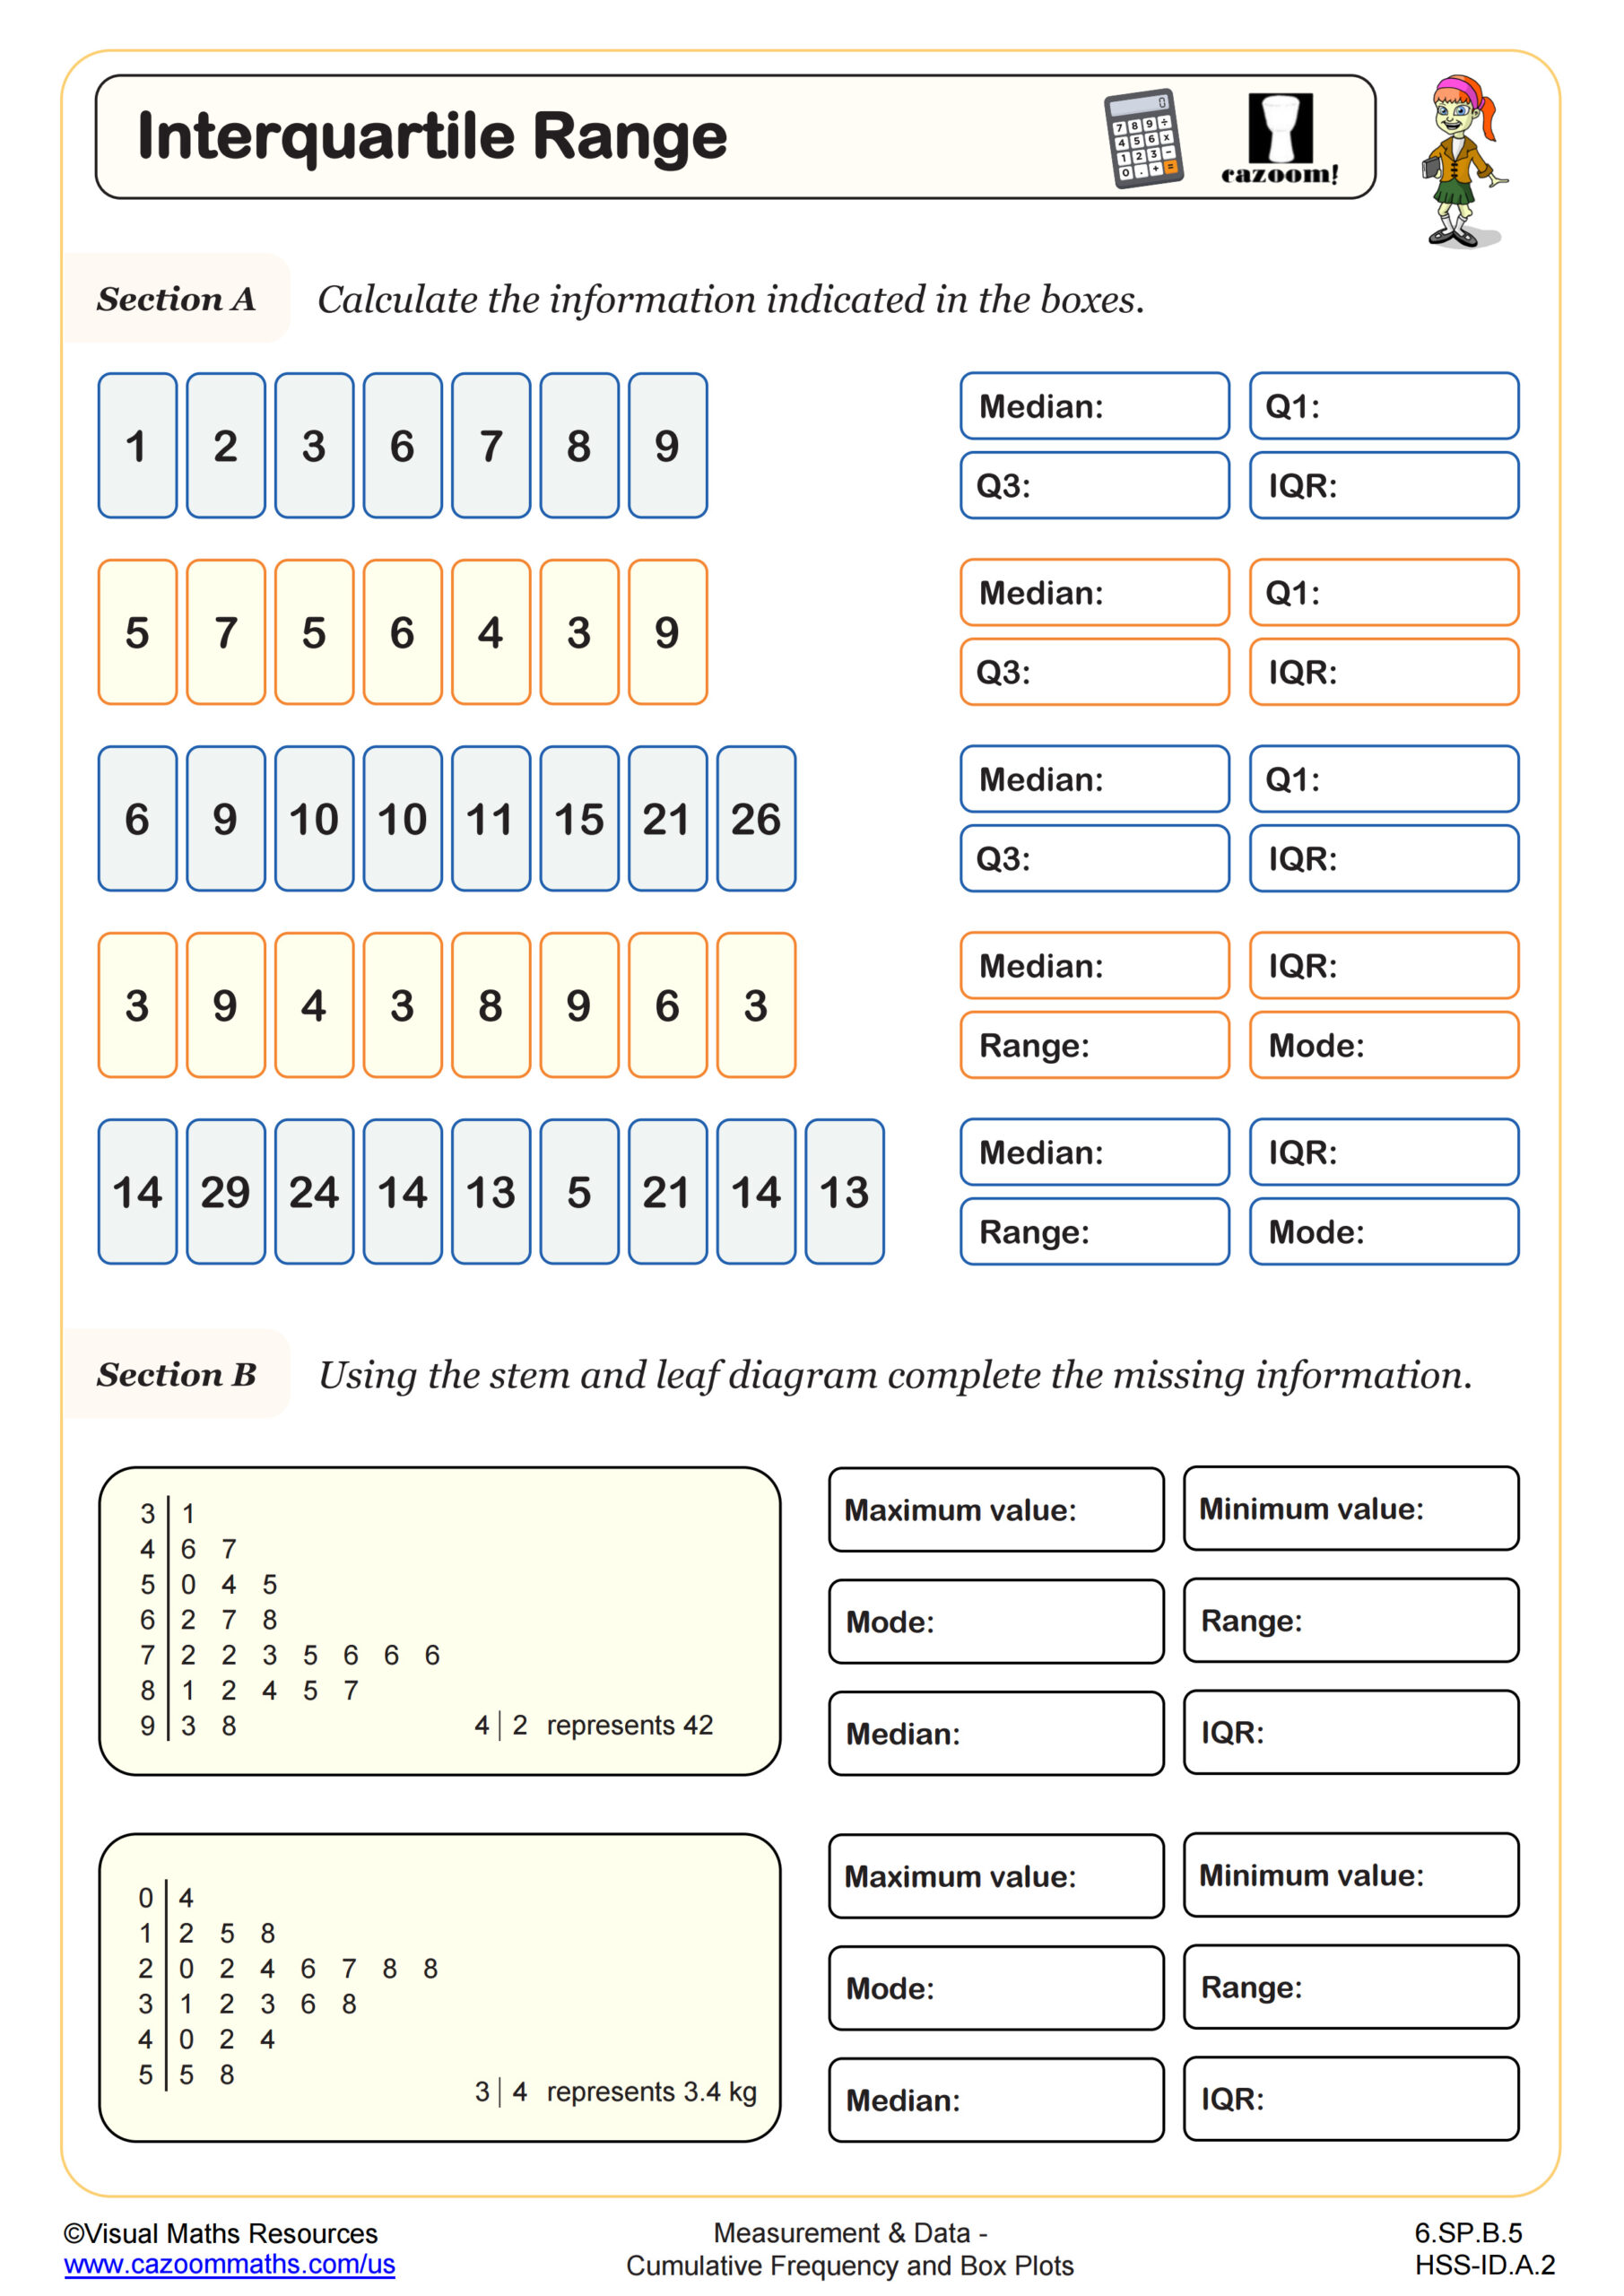
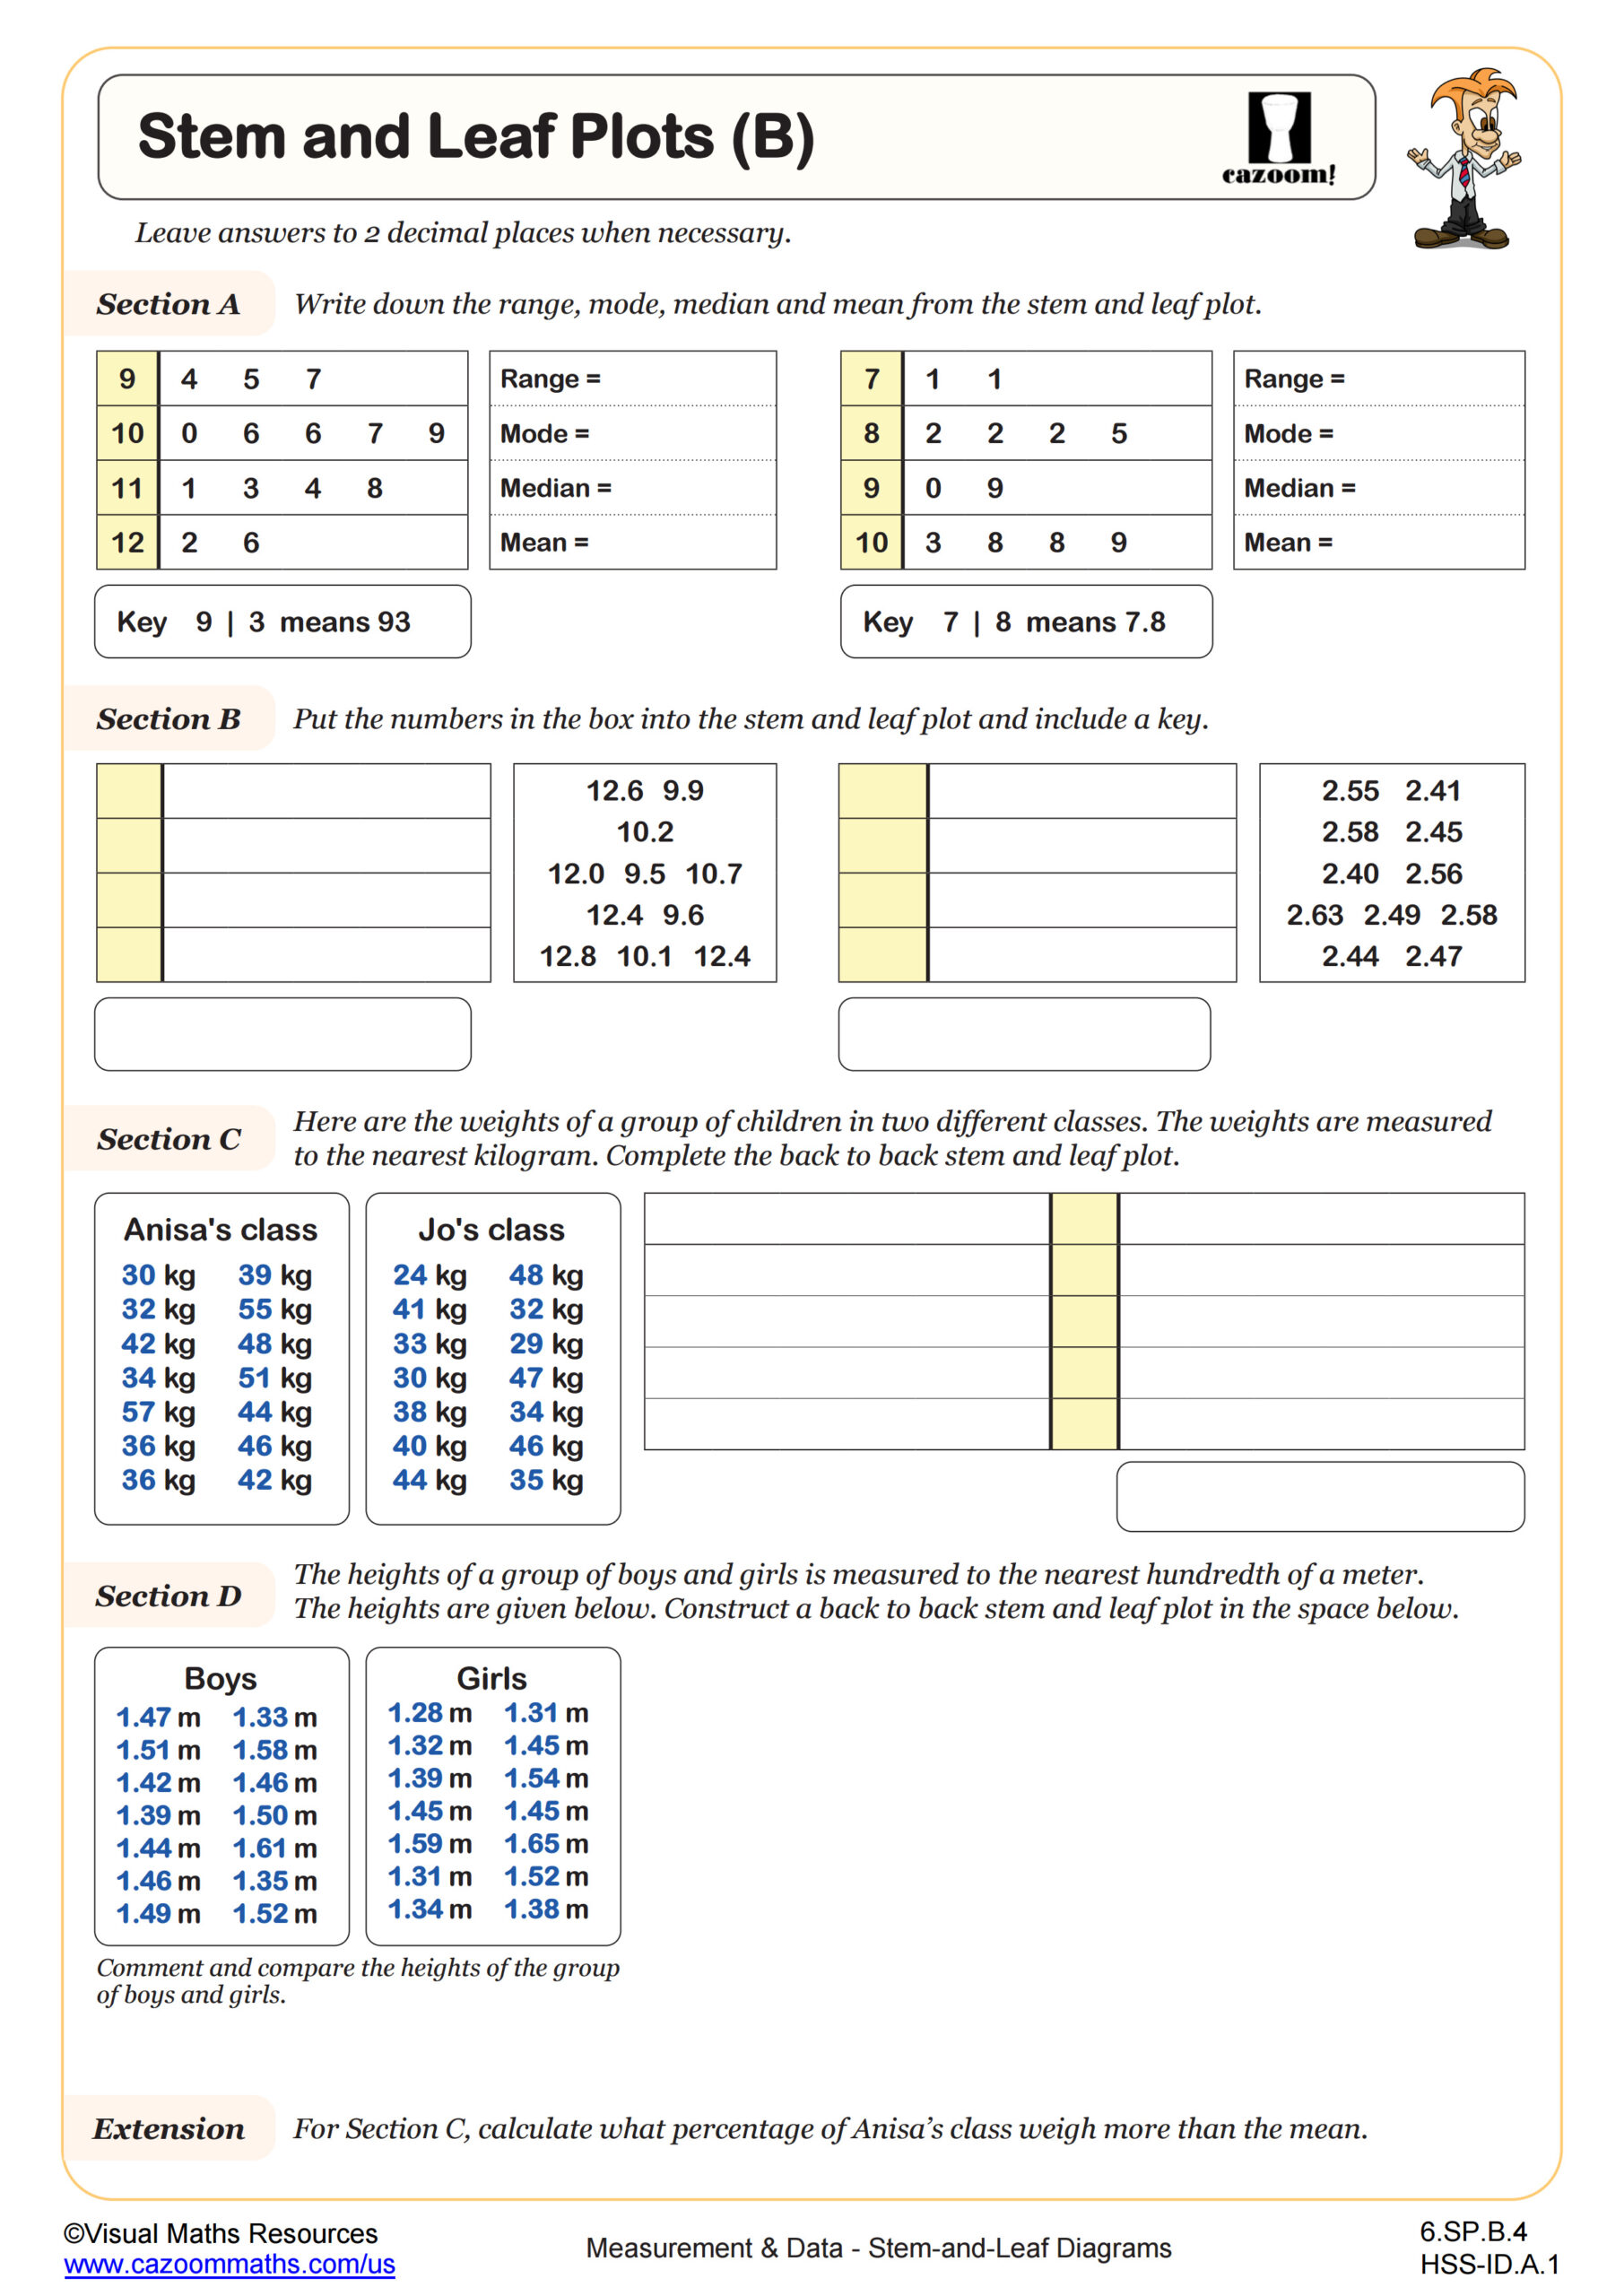
Our worksheets align with Common Core Standards for statistics and data. Students complete activities that involve building their own diagrams, answering questions, and analyzing results. They practice calculating the median, mode, and range from a plot. These exercises help students develop logical thinking and data literacy, preparing them for more advanced statistical concepts in high school math.
Real-Life Uses of Stem and Leaf Diagrams
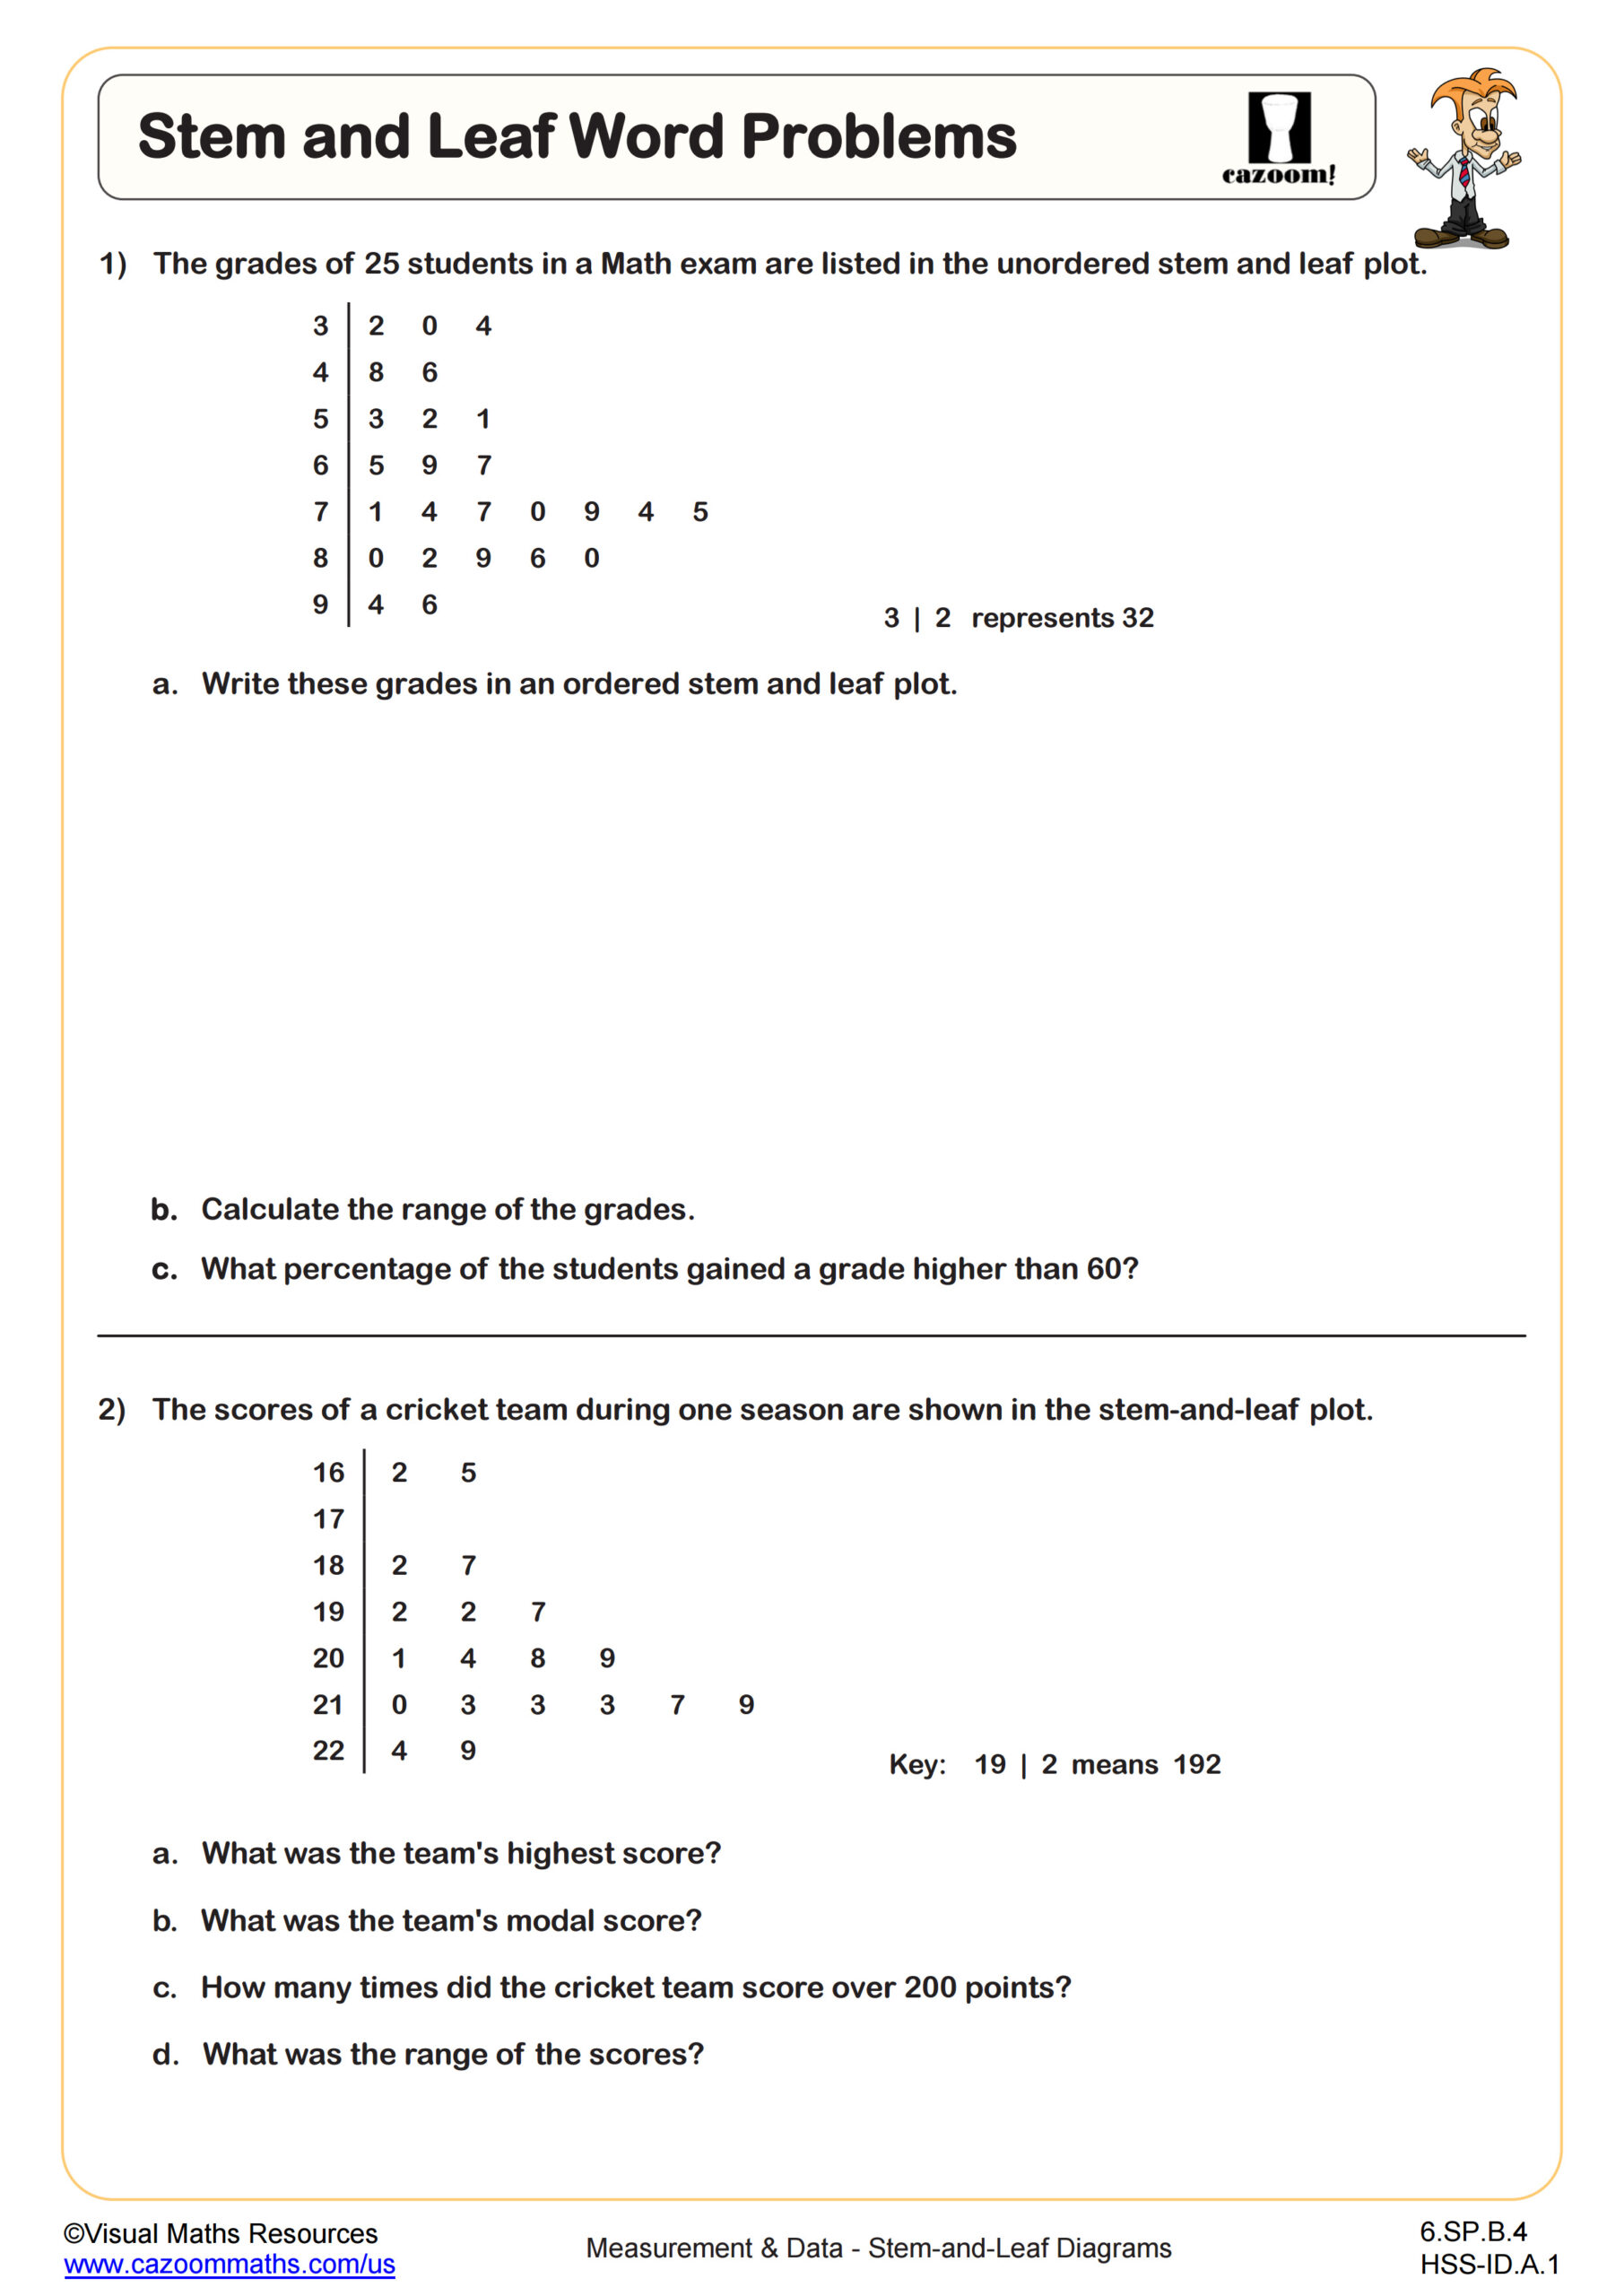
Stem and leaf diagrams are used in school surveys, sports statistics, and scientific experiments. They make it easier to sort and understand long lists of numbers. For example, students might analyze class test scores or record temperatures over a week. Learning how to read and make these plots helps students organize information clearly and make better decisions based on data.
Requisite Knowledge Before Learning Stem and Leaf Diagrams
Before working on these worksheets, students should be able to:
• Order numbers from least to greatest
• Understand place value (ones, tens, hundreds)
• Identify median, mode, and range
• Read and compare data from simple charts or tables
These foundational skills prepare students to successfully build and analyze stem and leaf plots with accuracy and understanding.