Statistics Worksheets With Answers
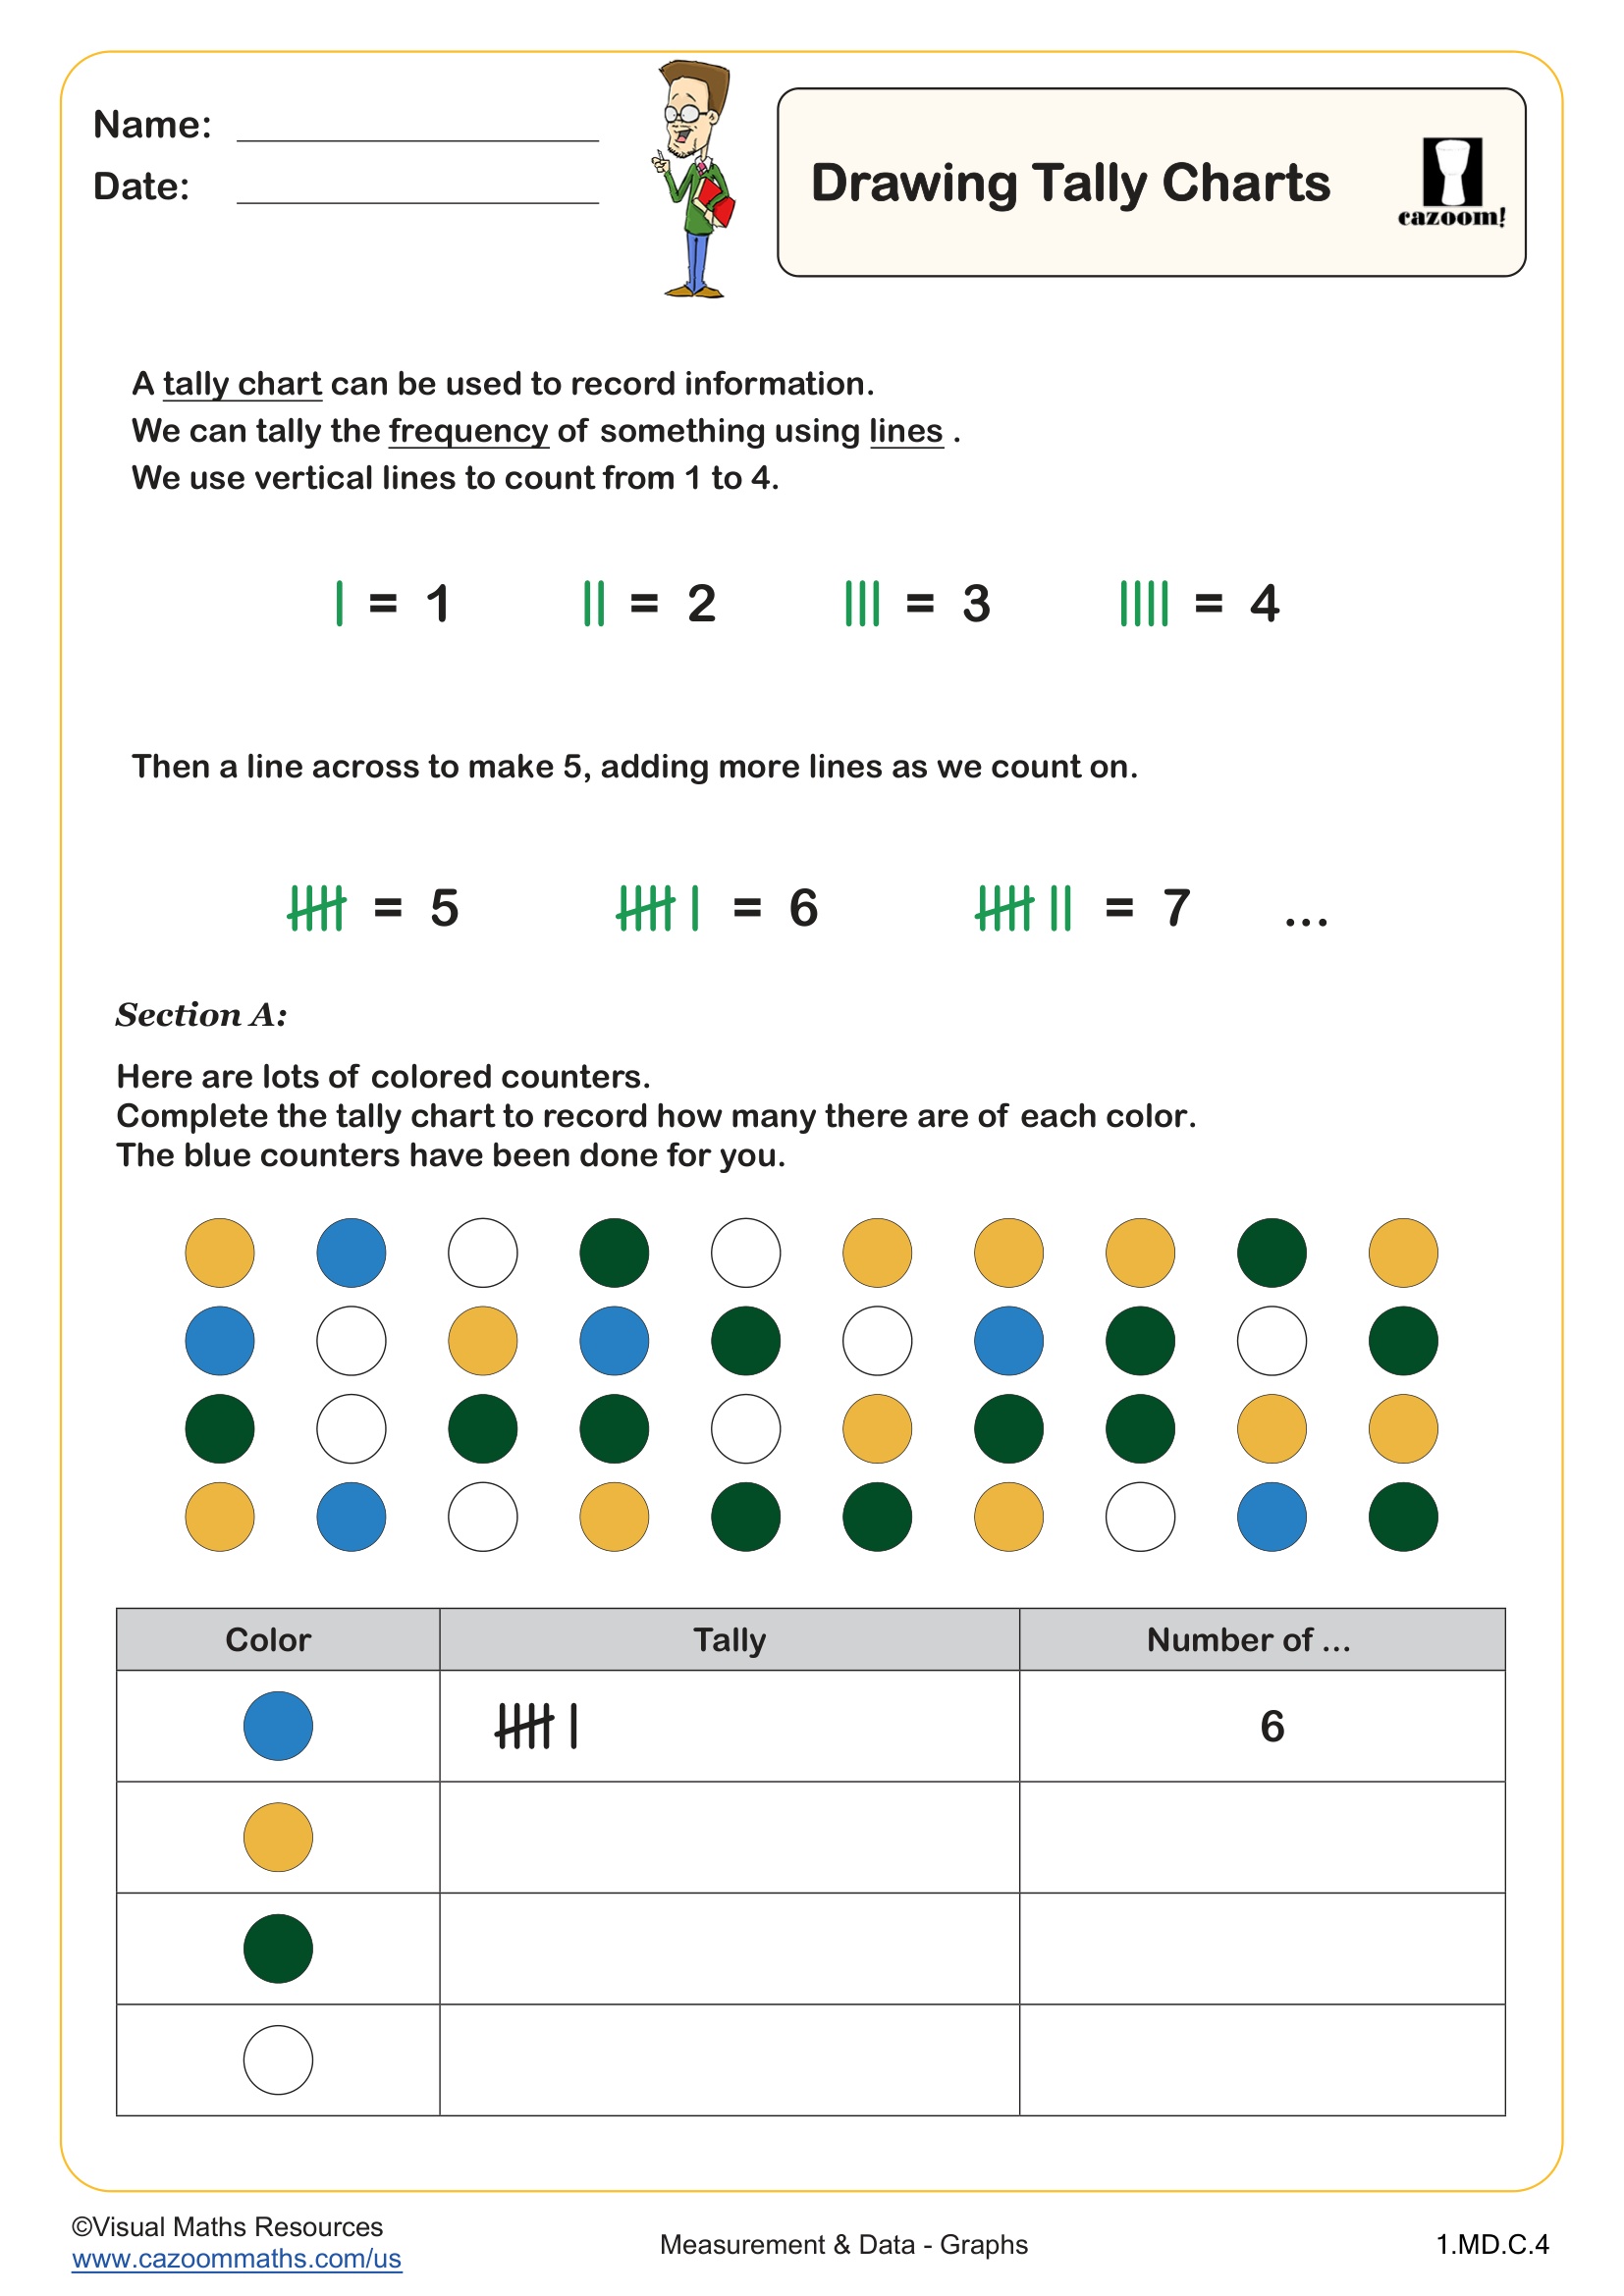
Drawing Tally Charts
Grades: 1st Grade
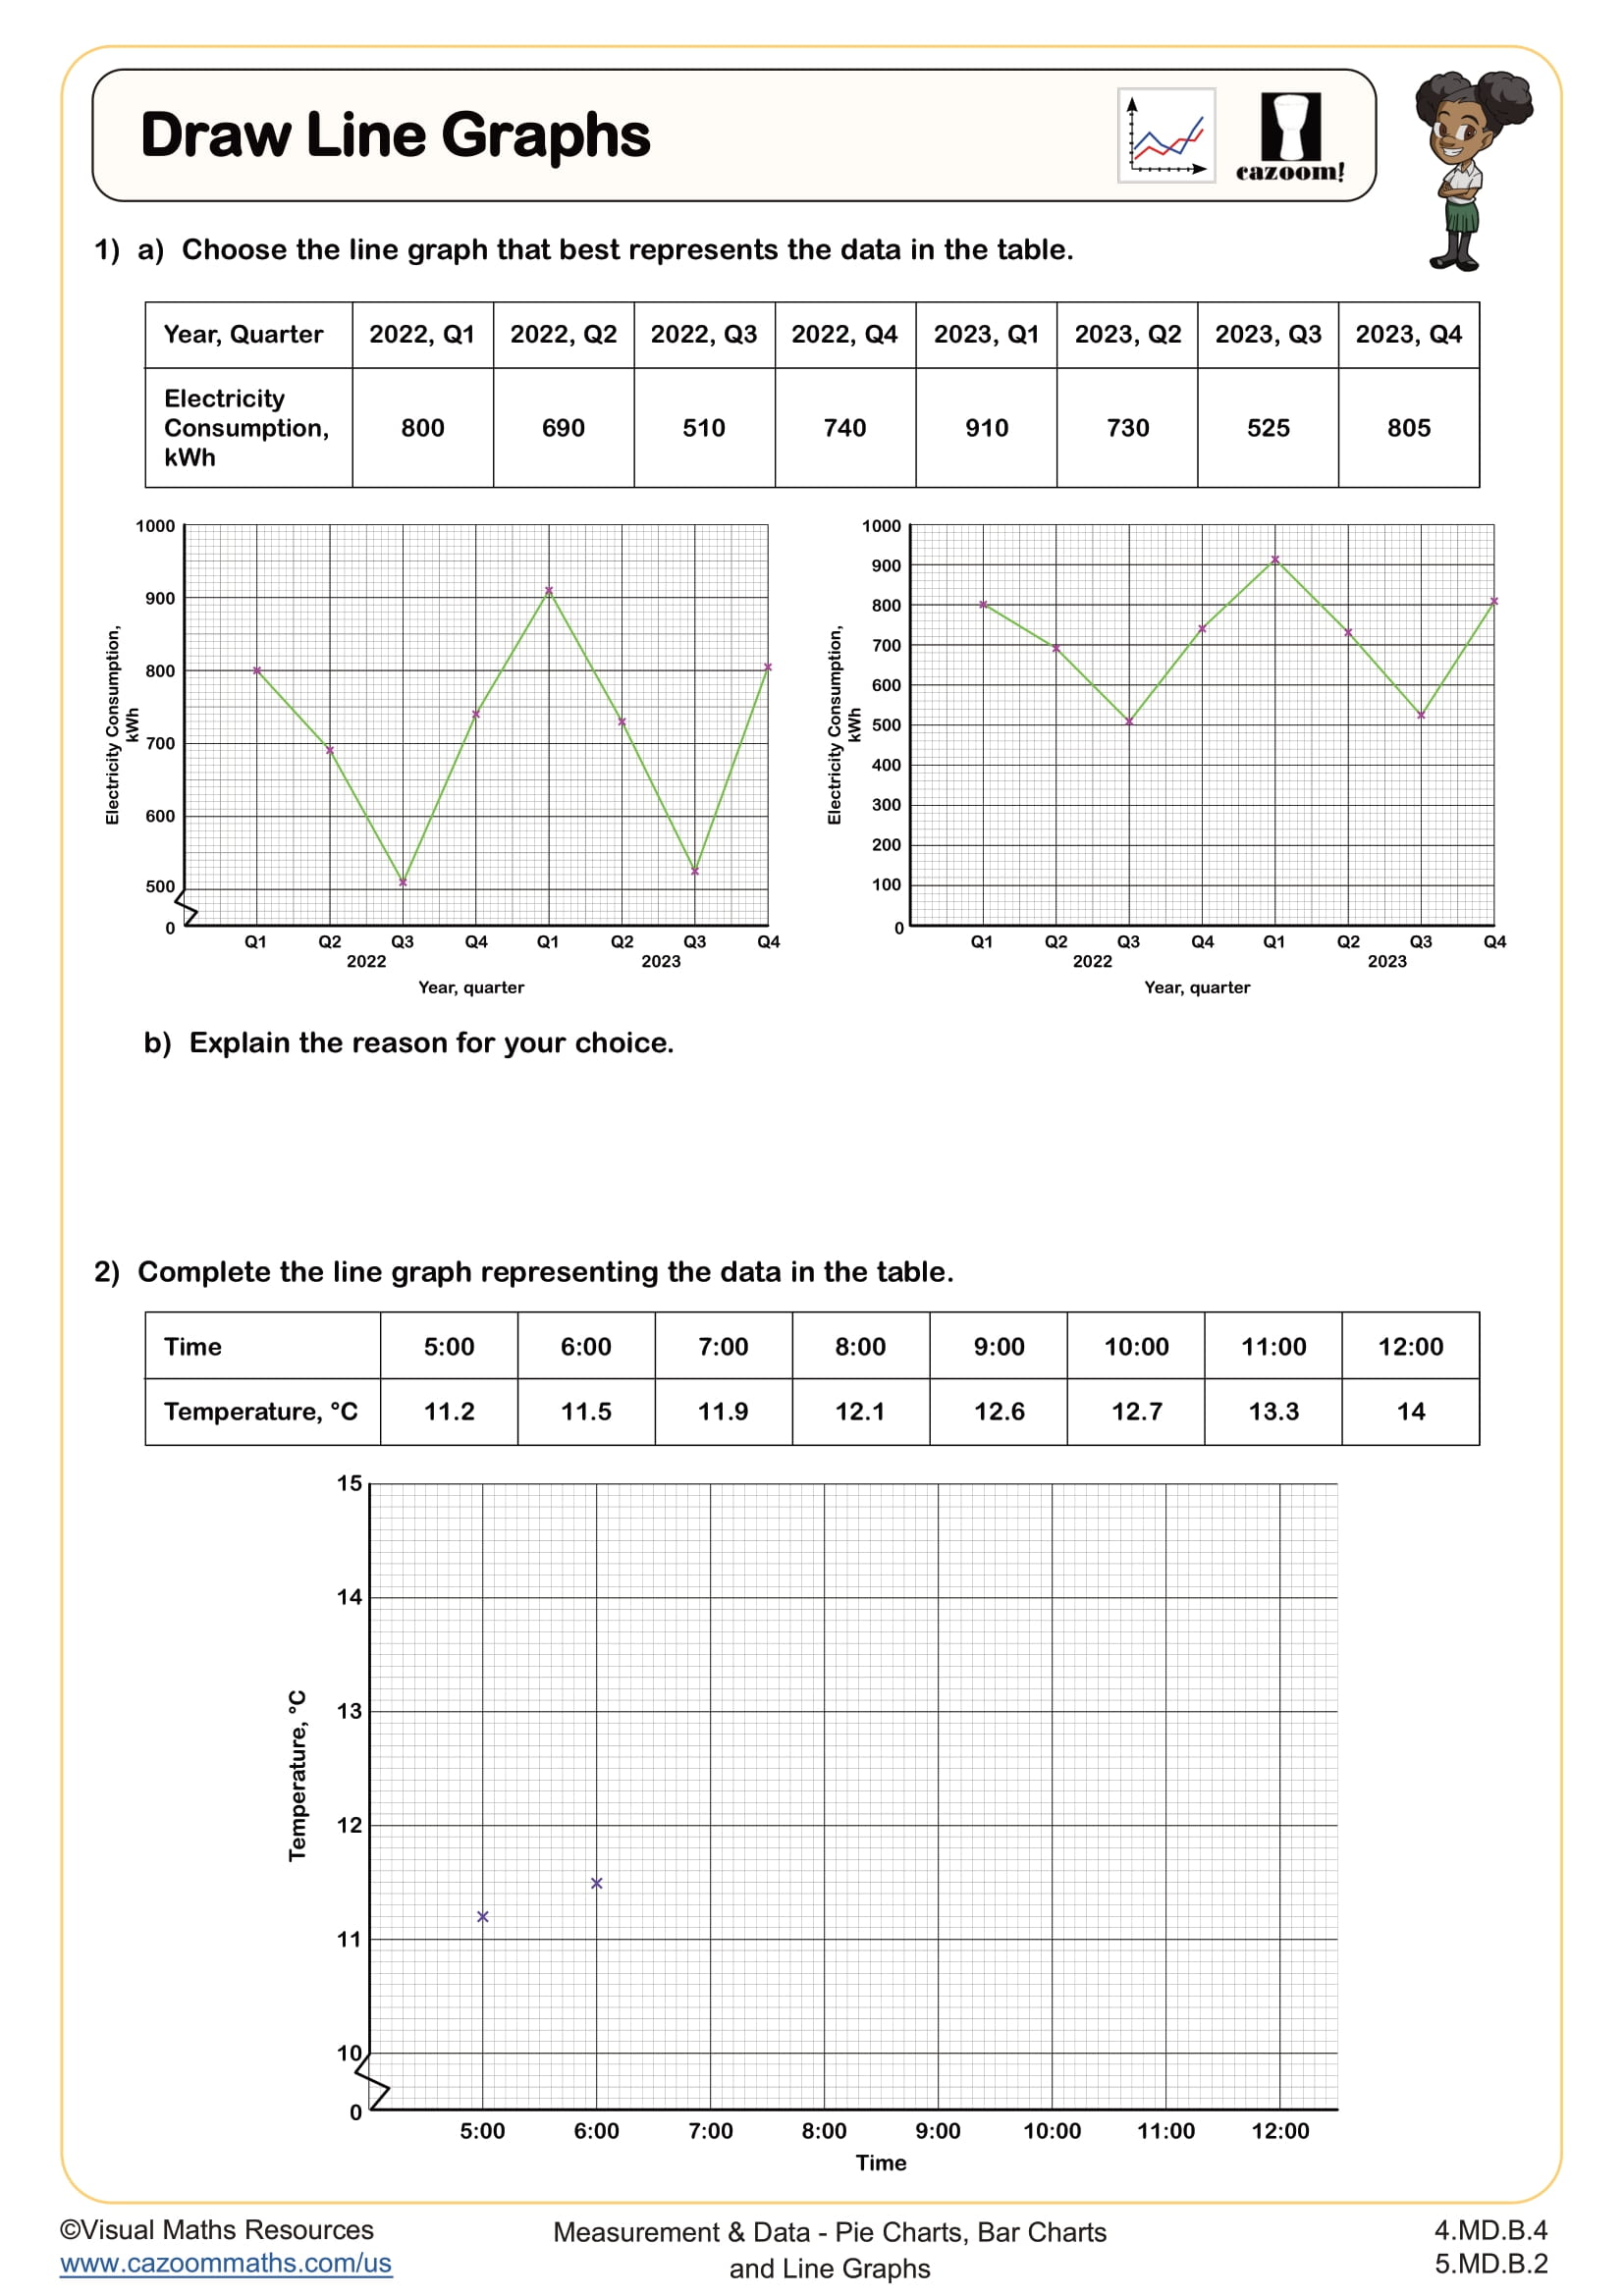
Draw Line Graphs
Grades: 4th Grade, 5th Grade
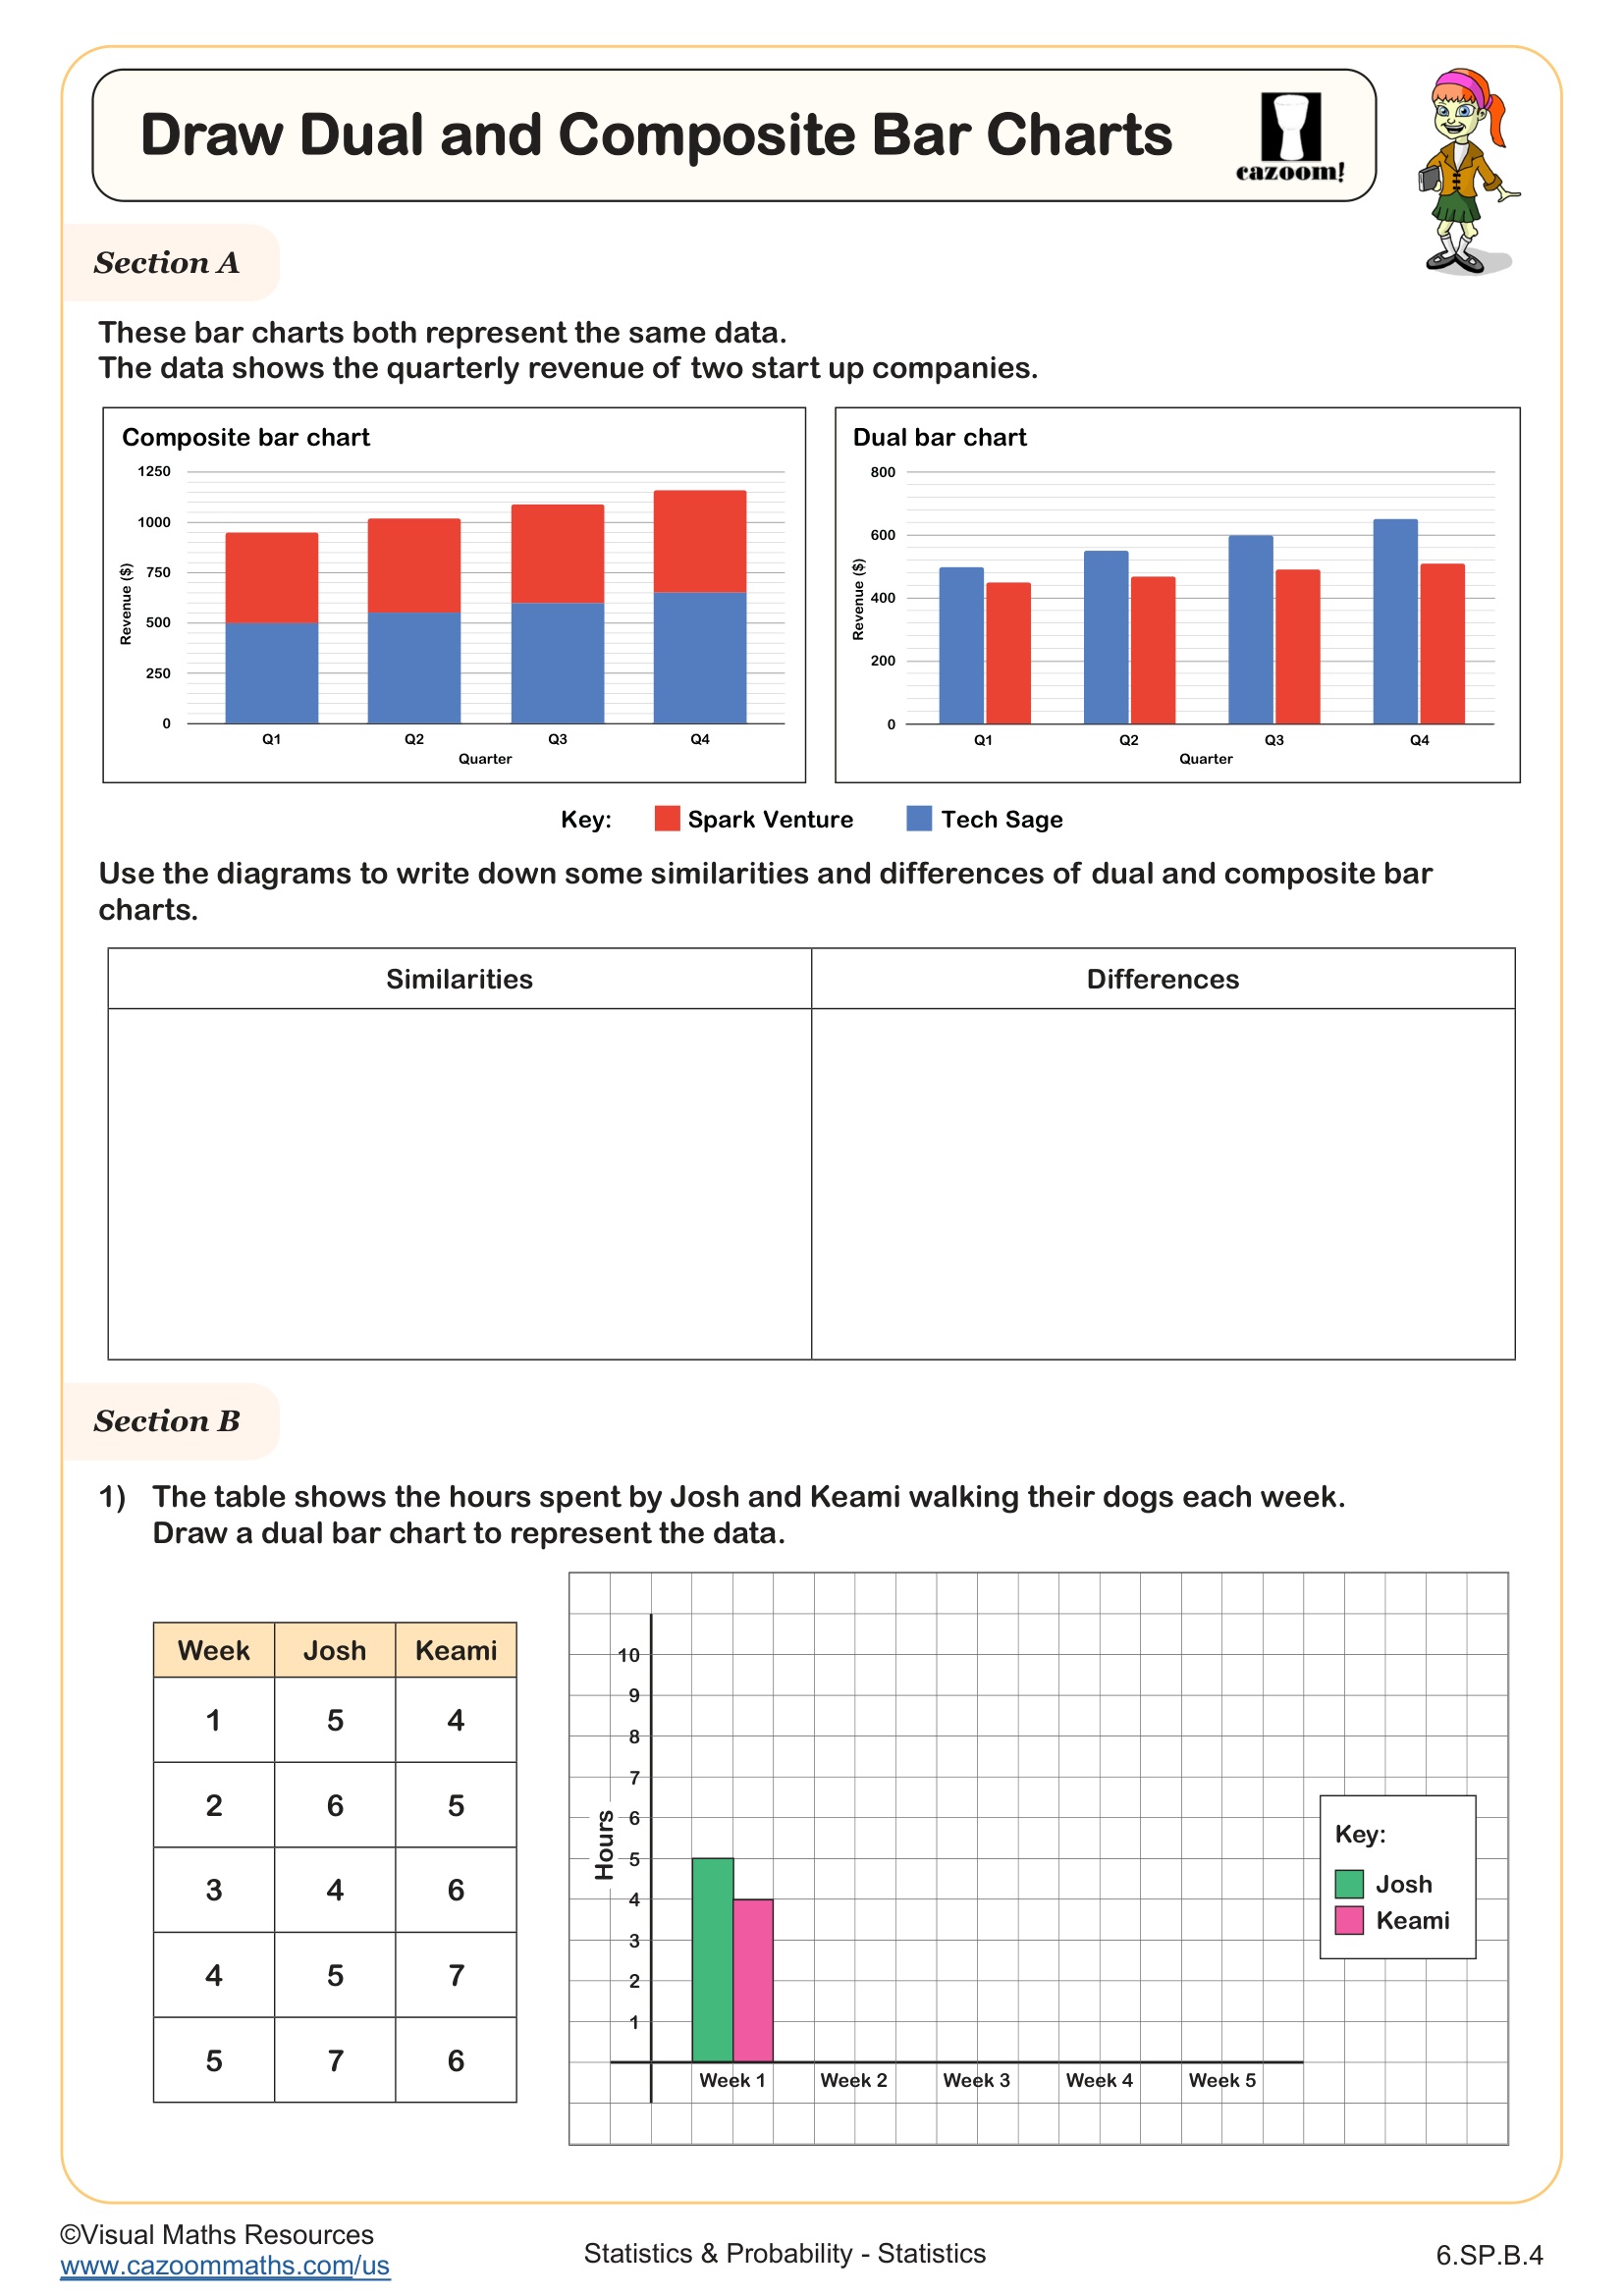
Draw Composite and Dual Bar Charts
Grades: 6th Grade
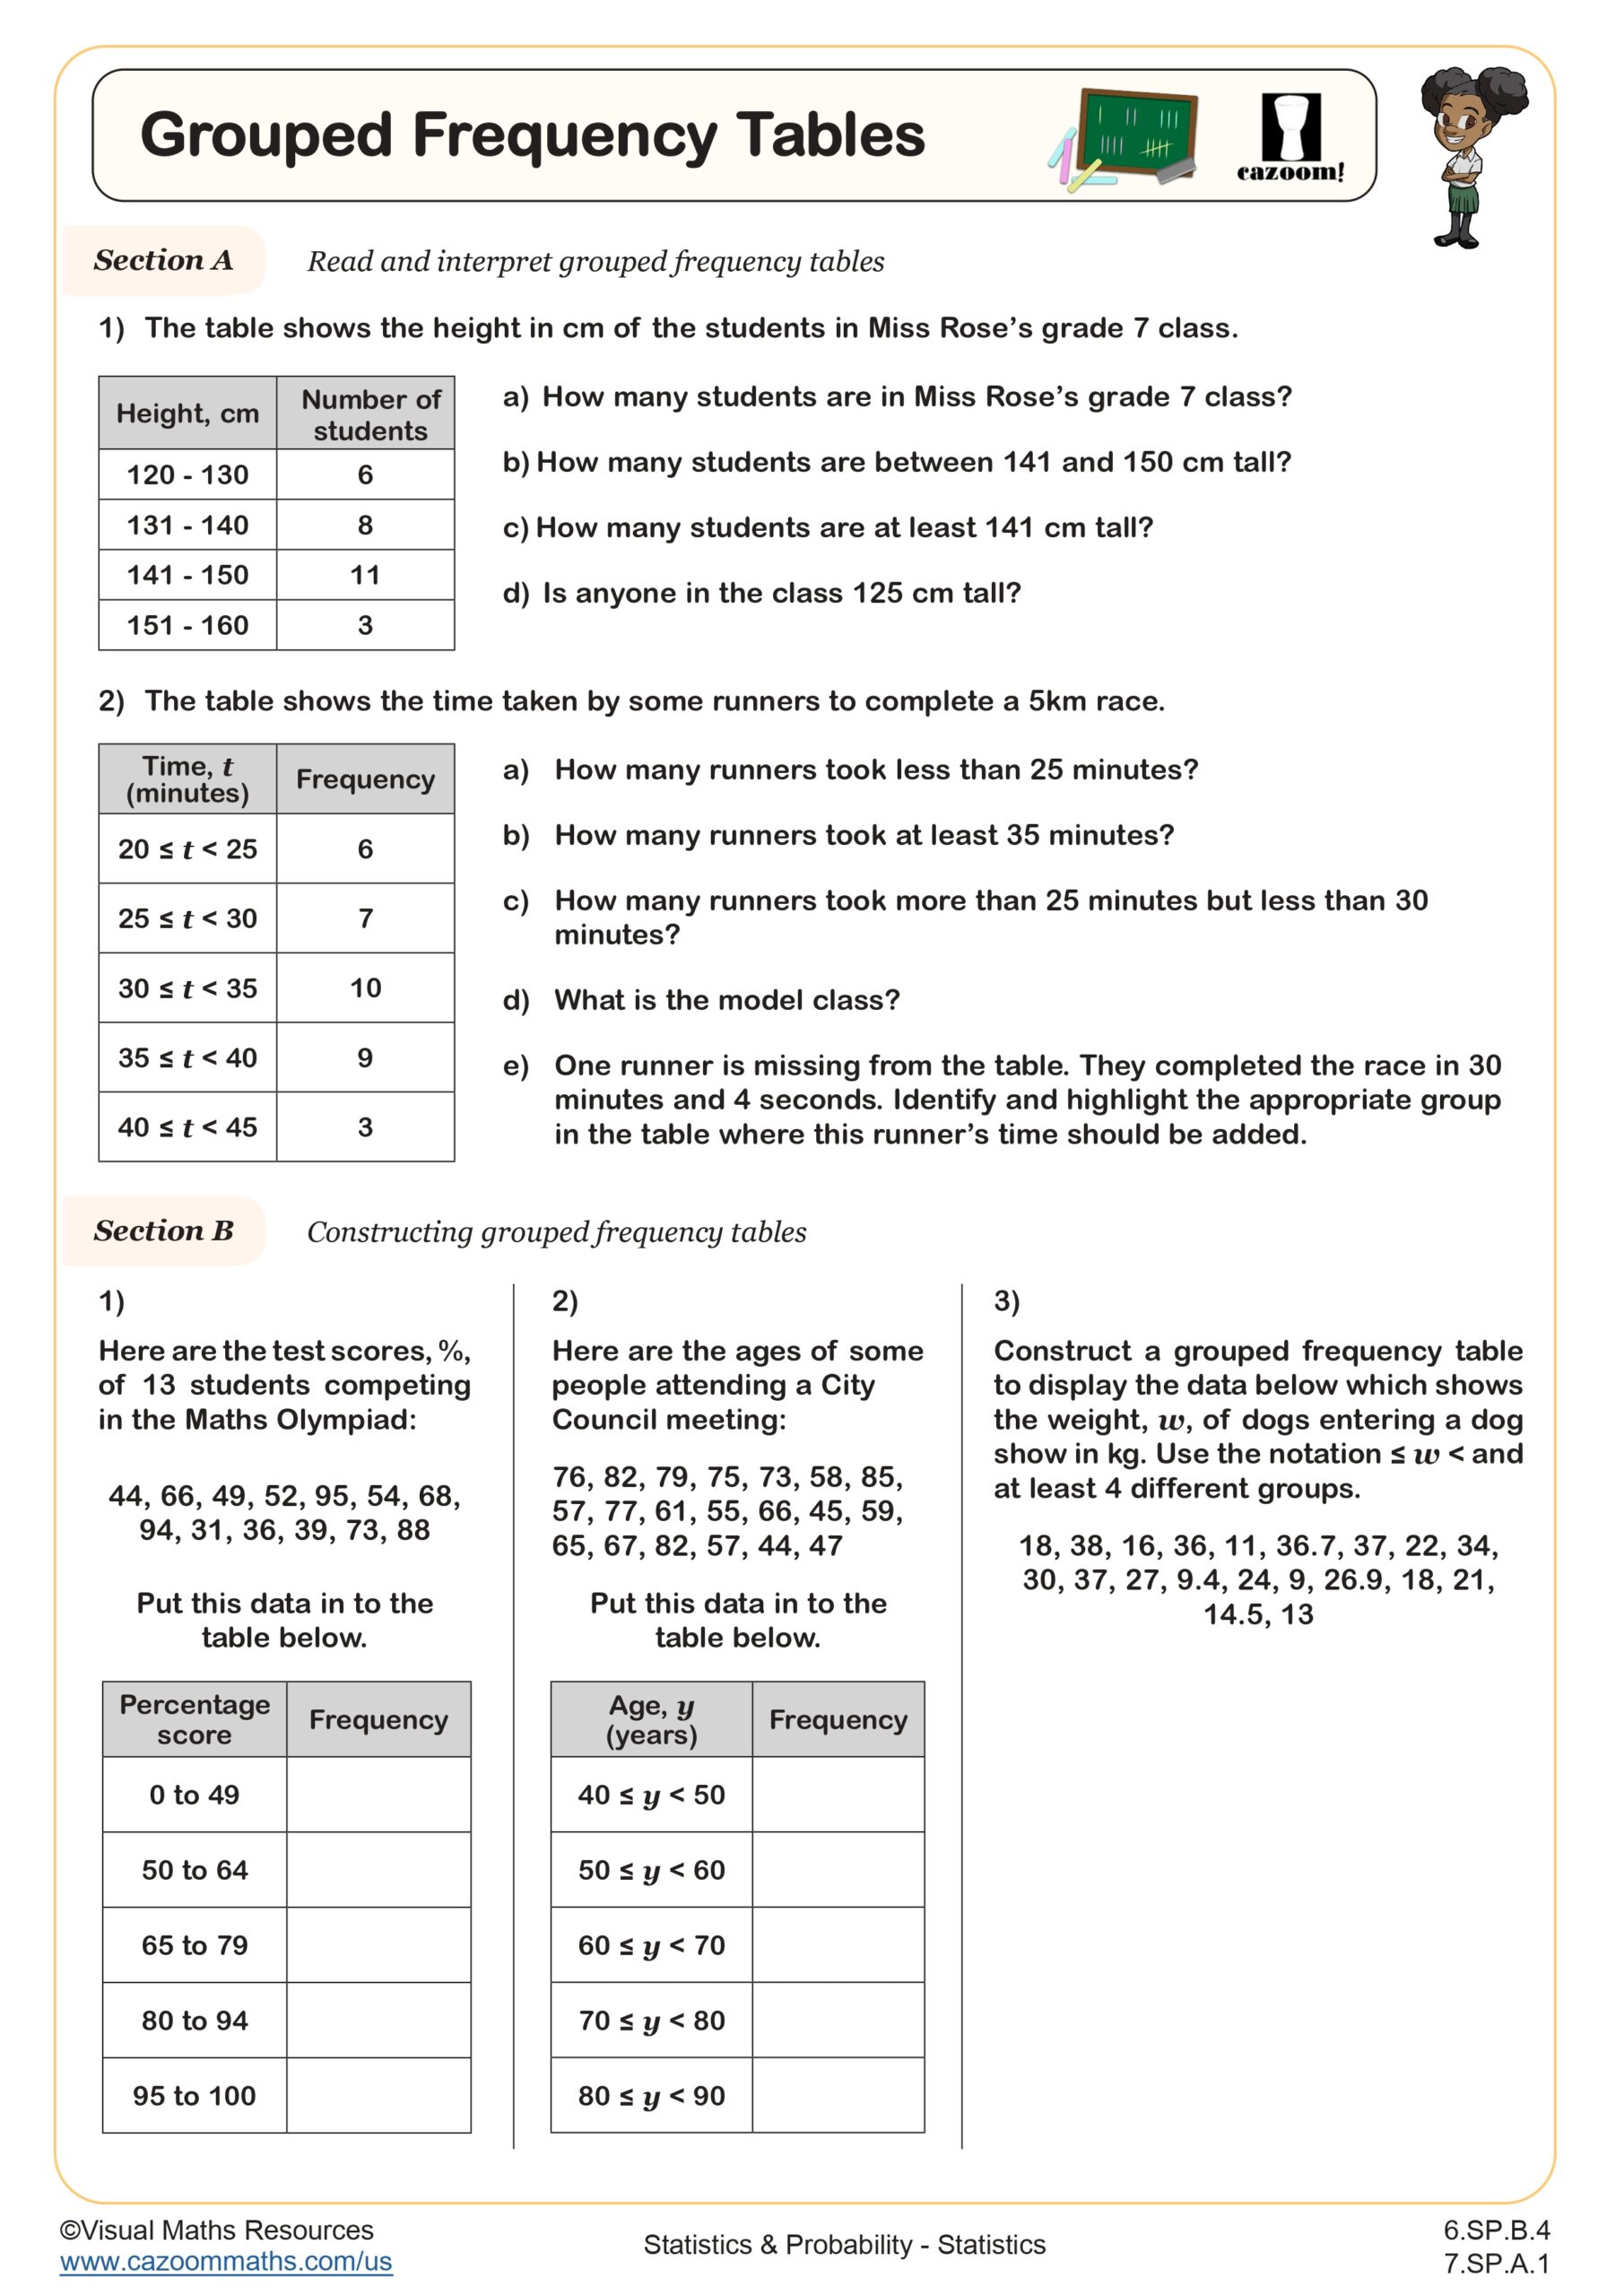
Grouped Frequency Tables
Grades: 6th Grade, 7th Grade
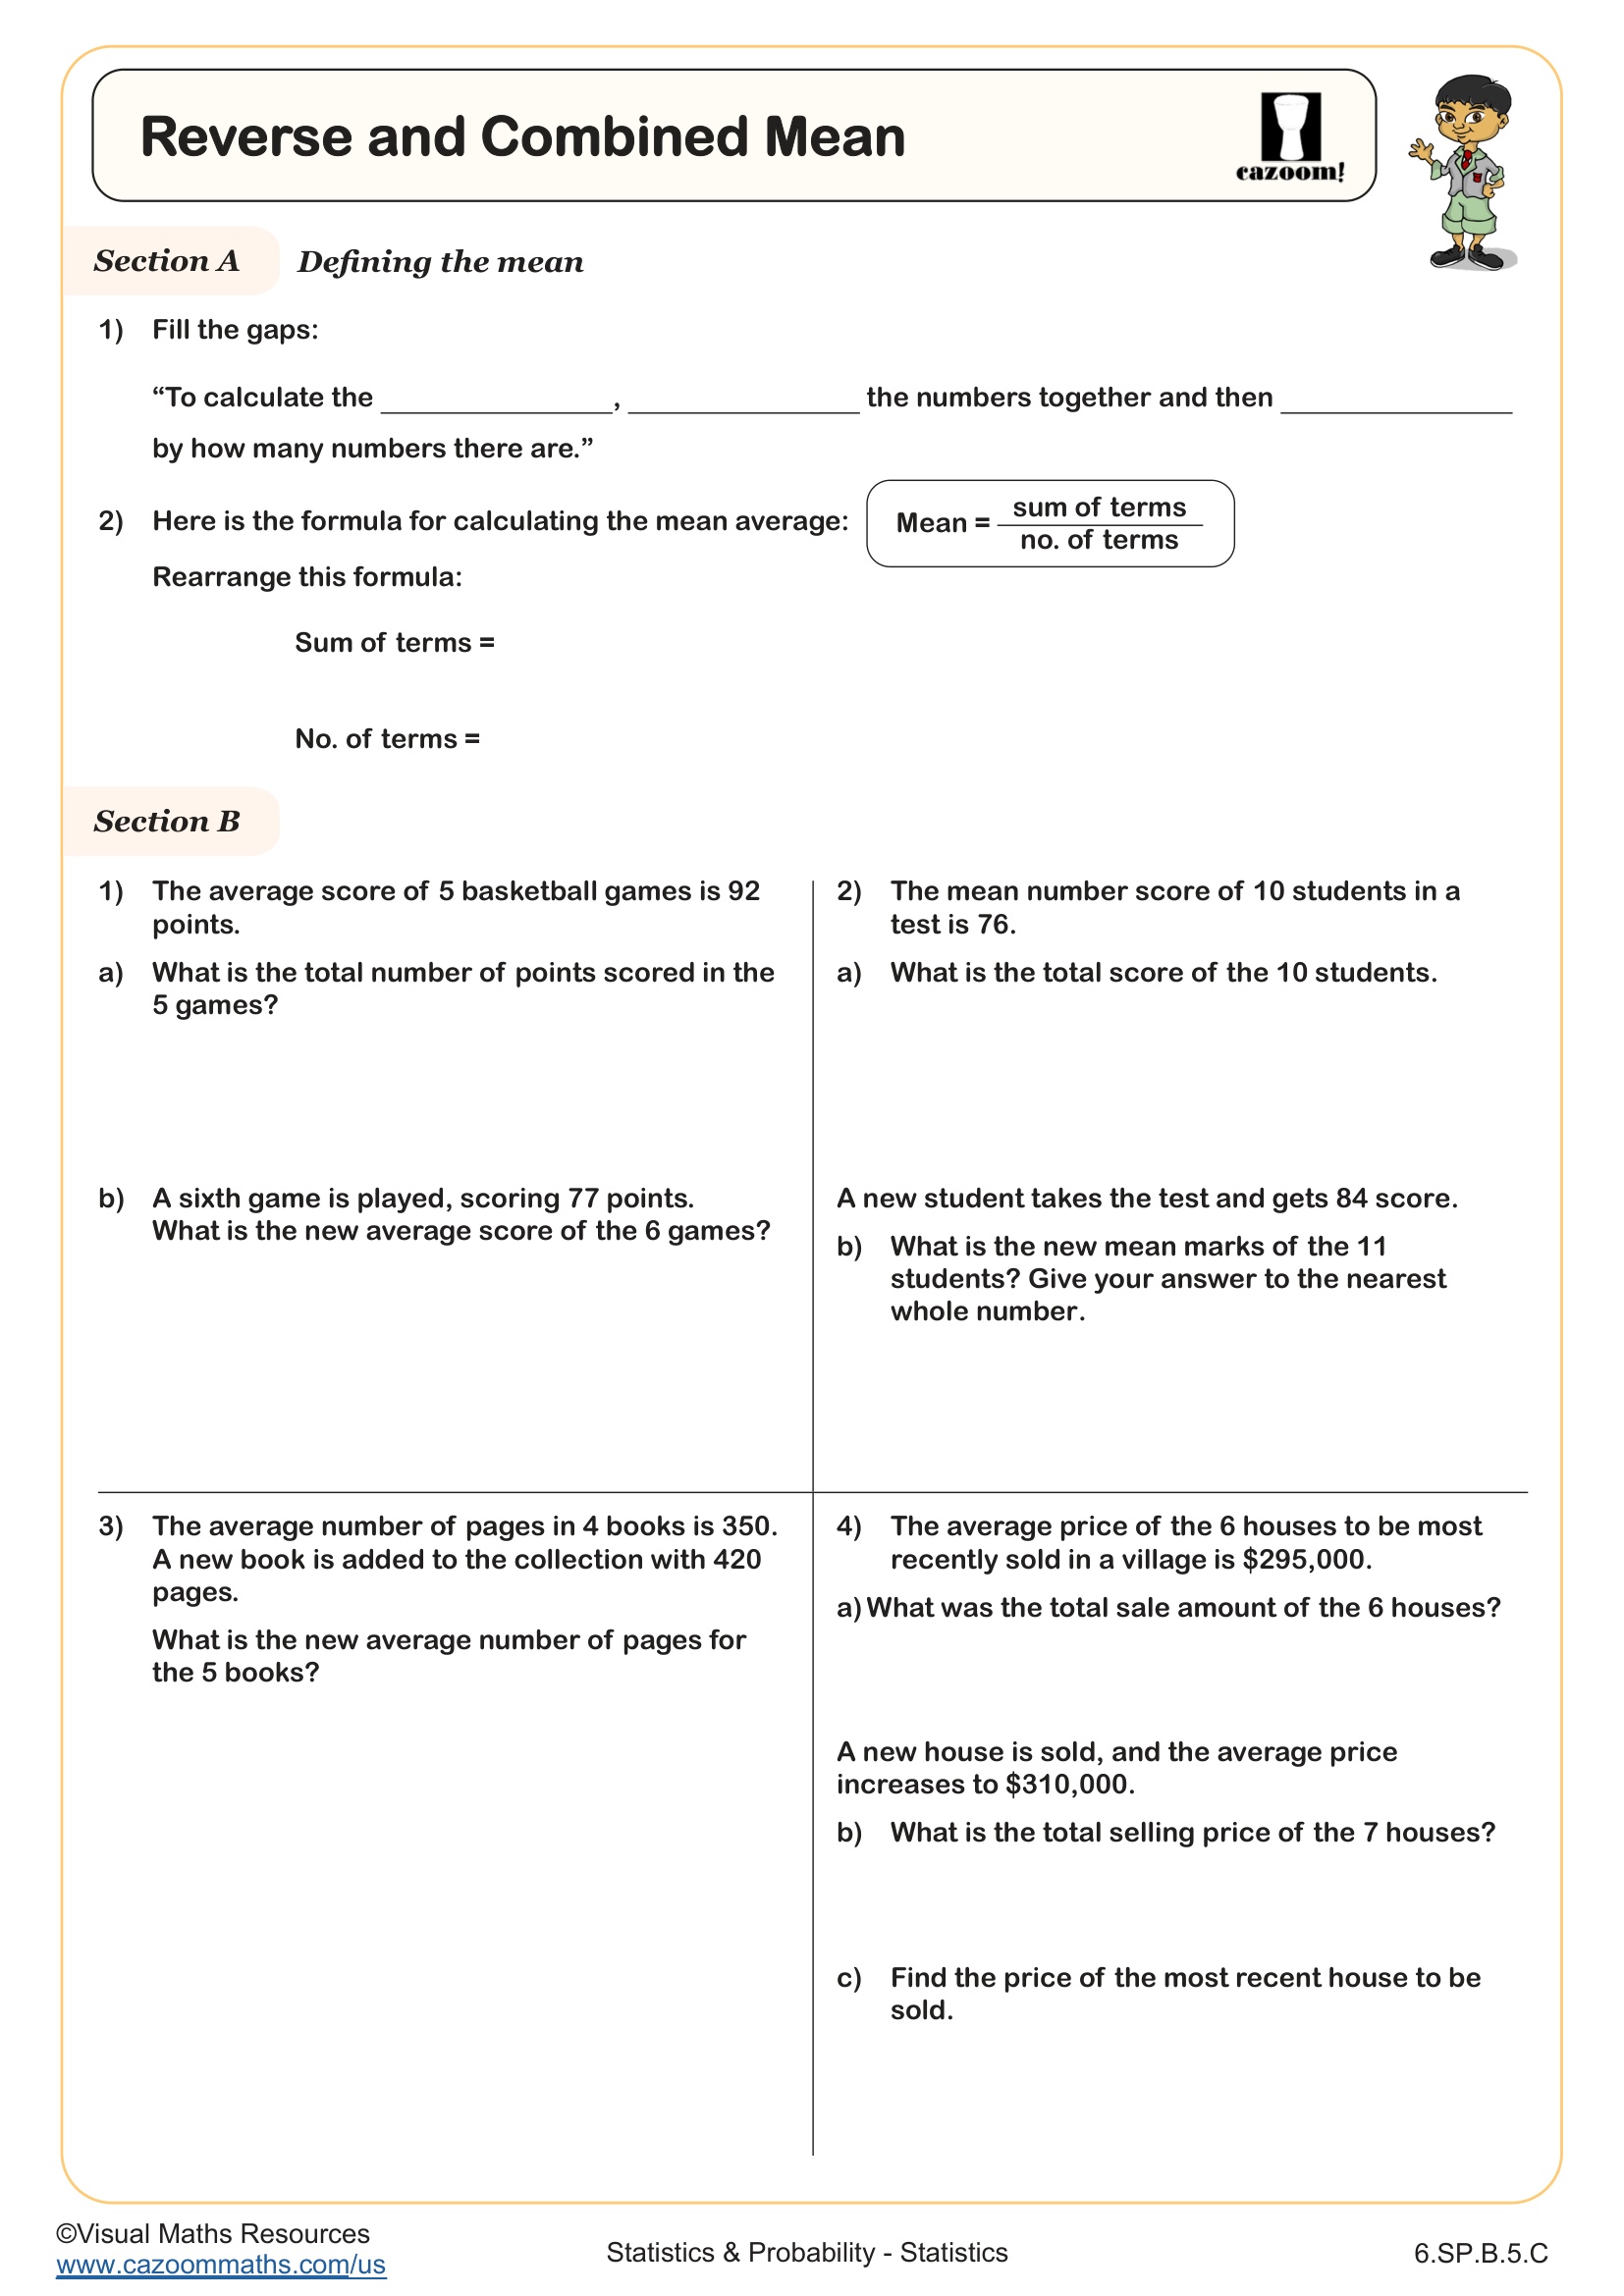
Reverse and Combined Mean
Grades: 6th Grade
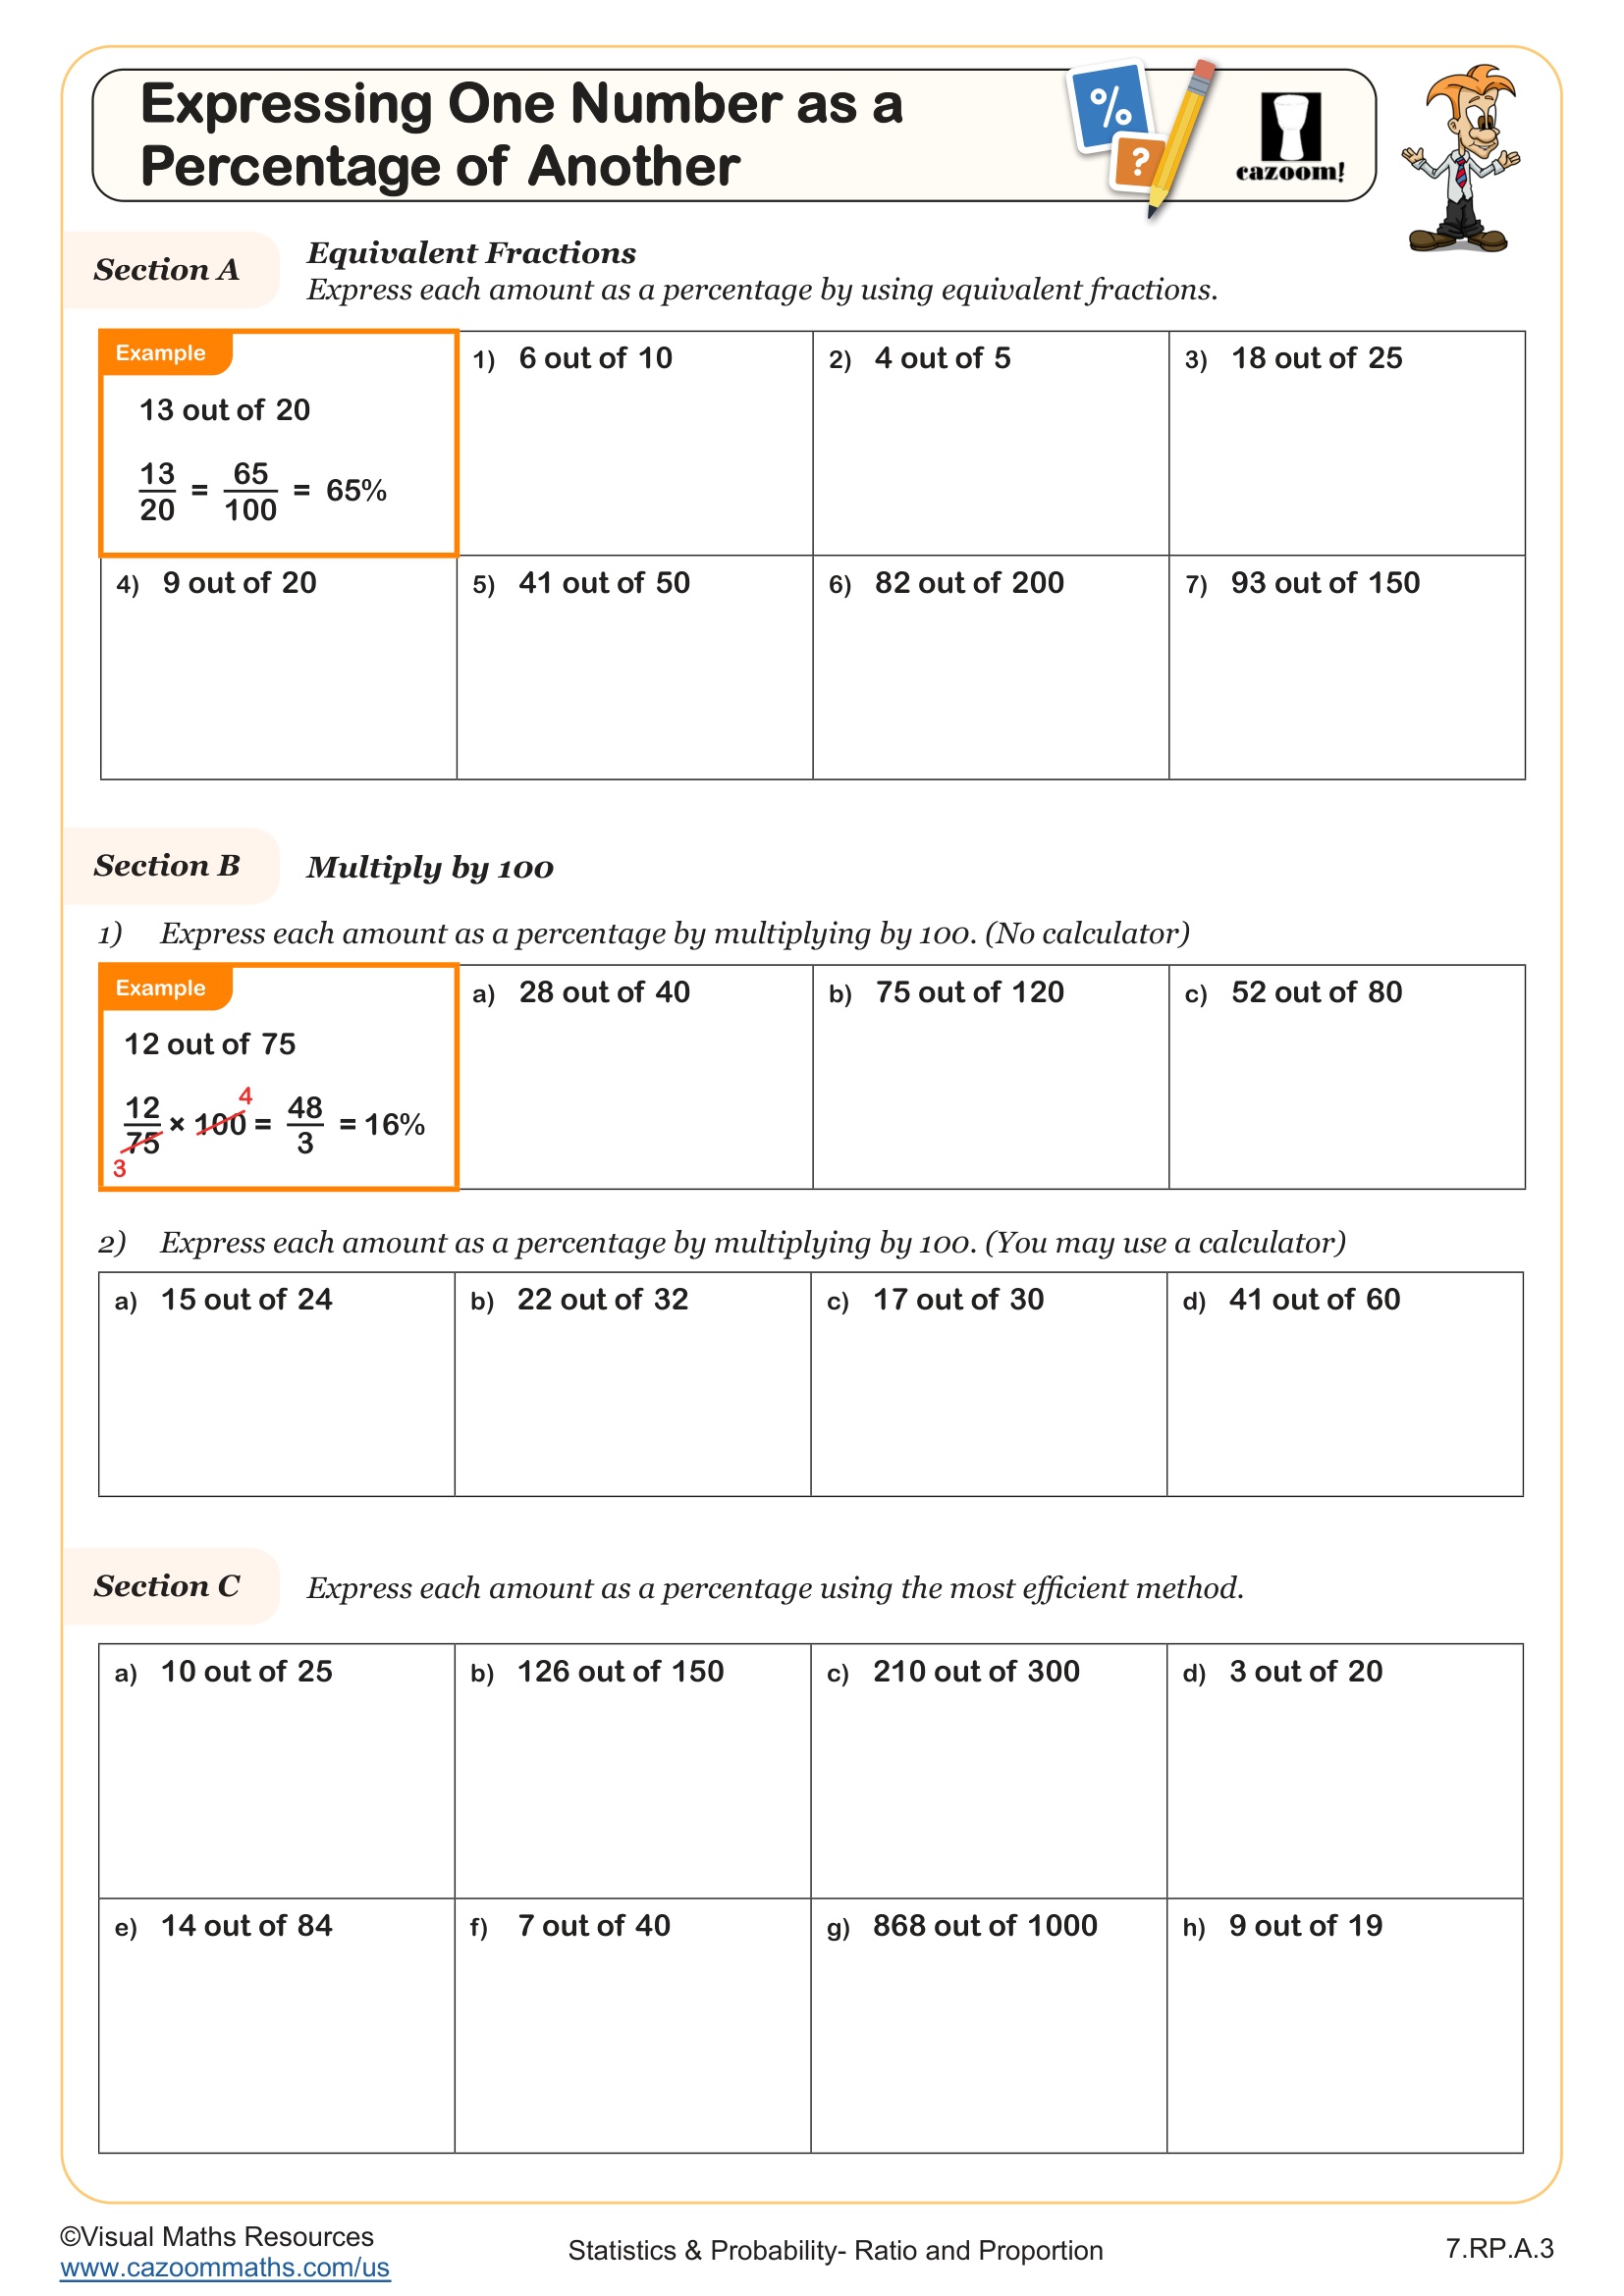
Express One Number as a Percentage of Another
Grades: 7th Grade
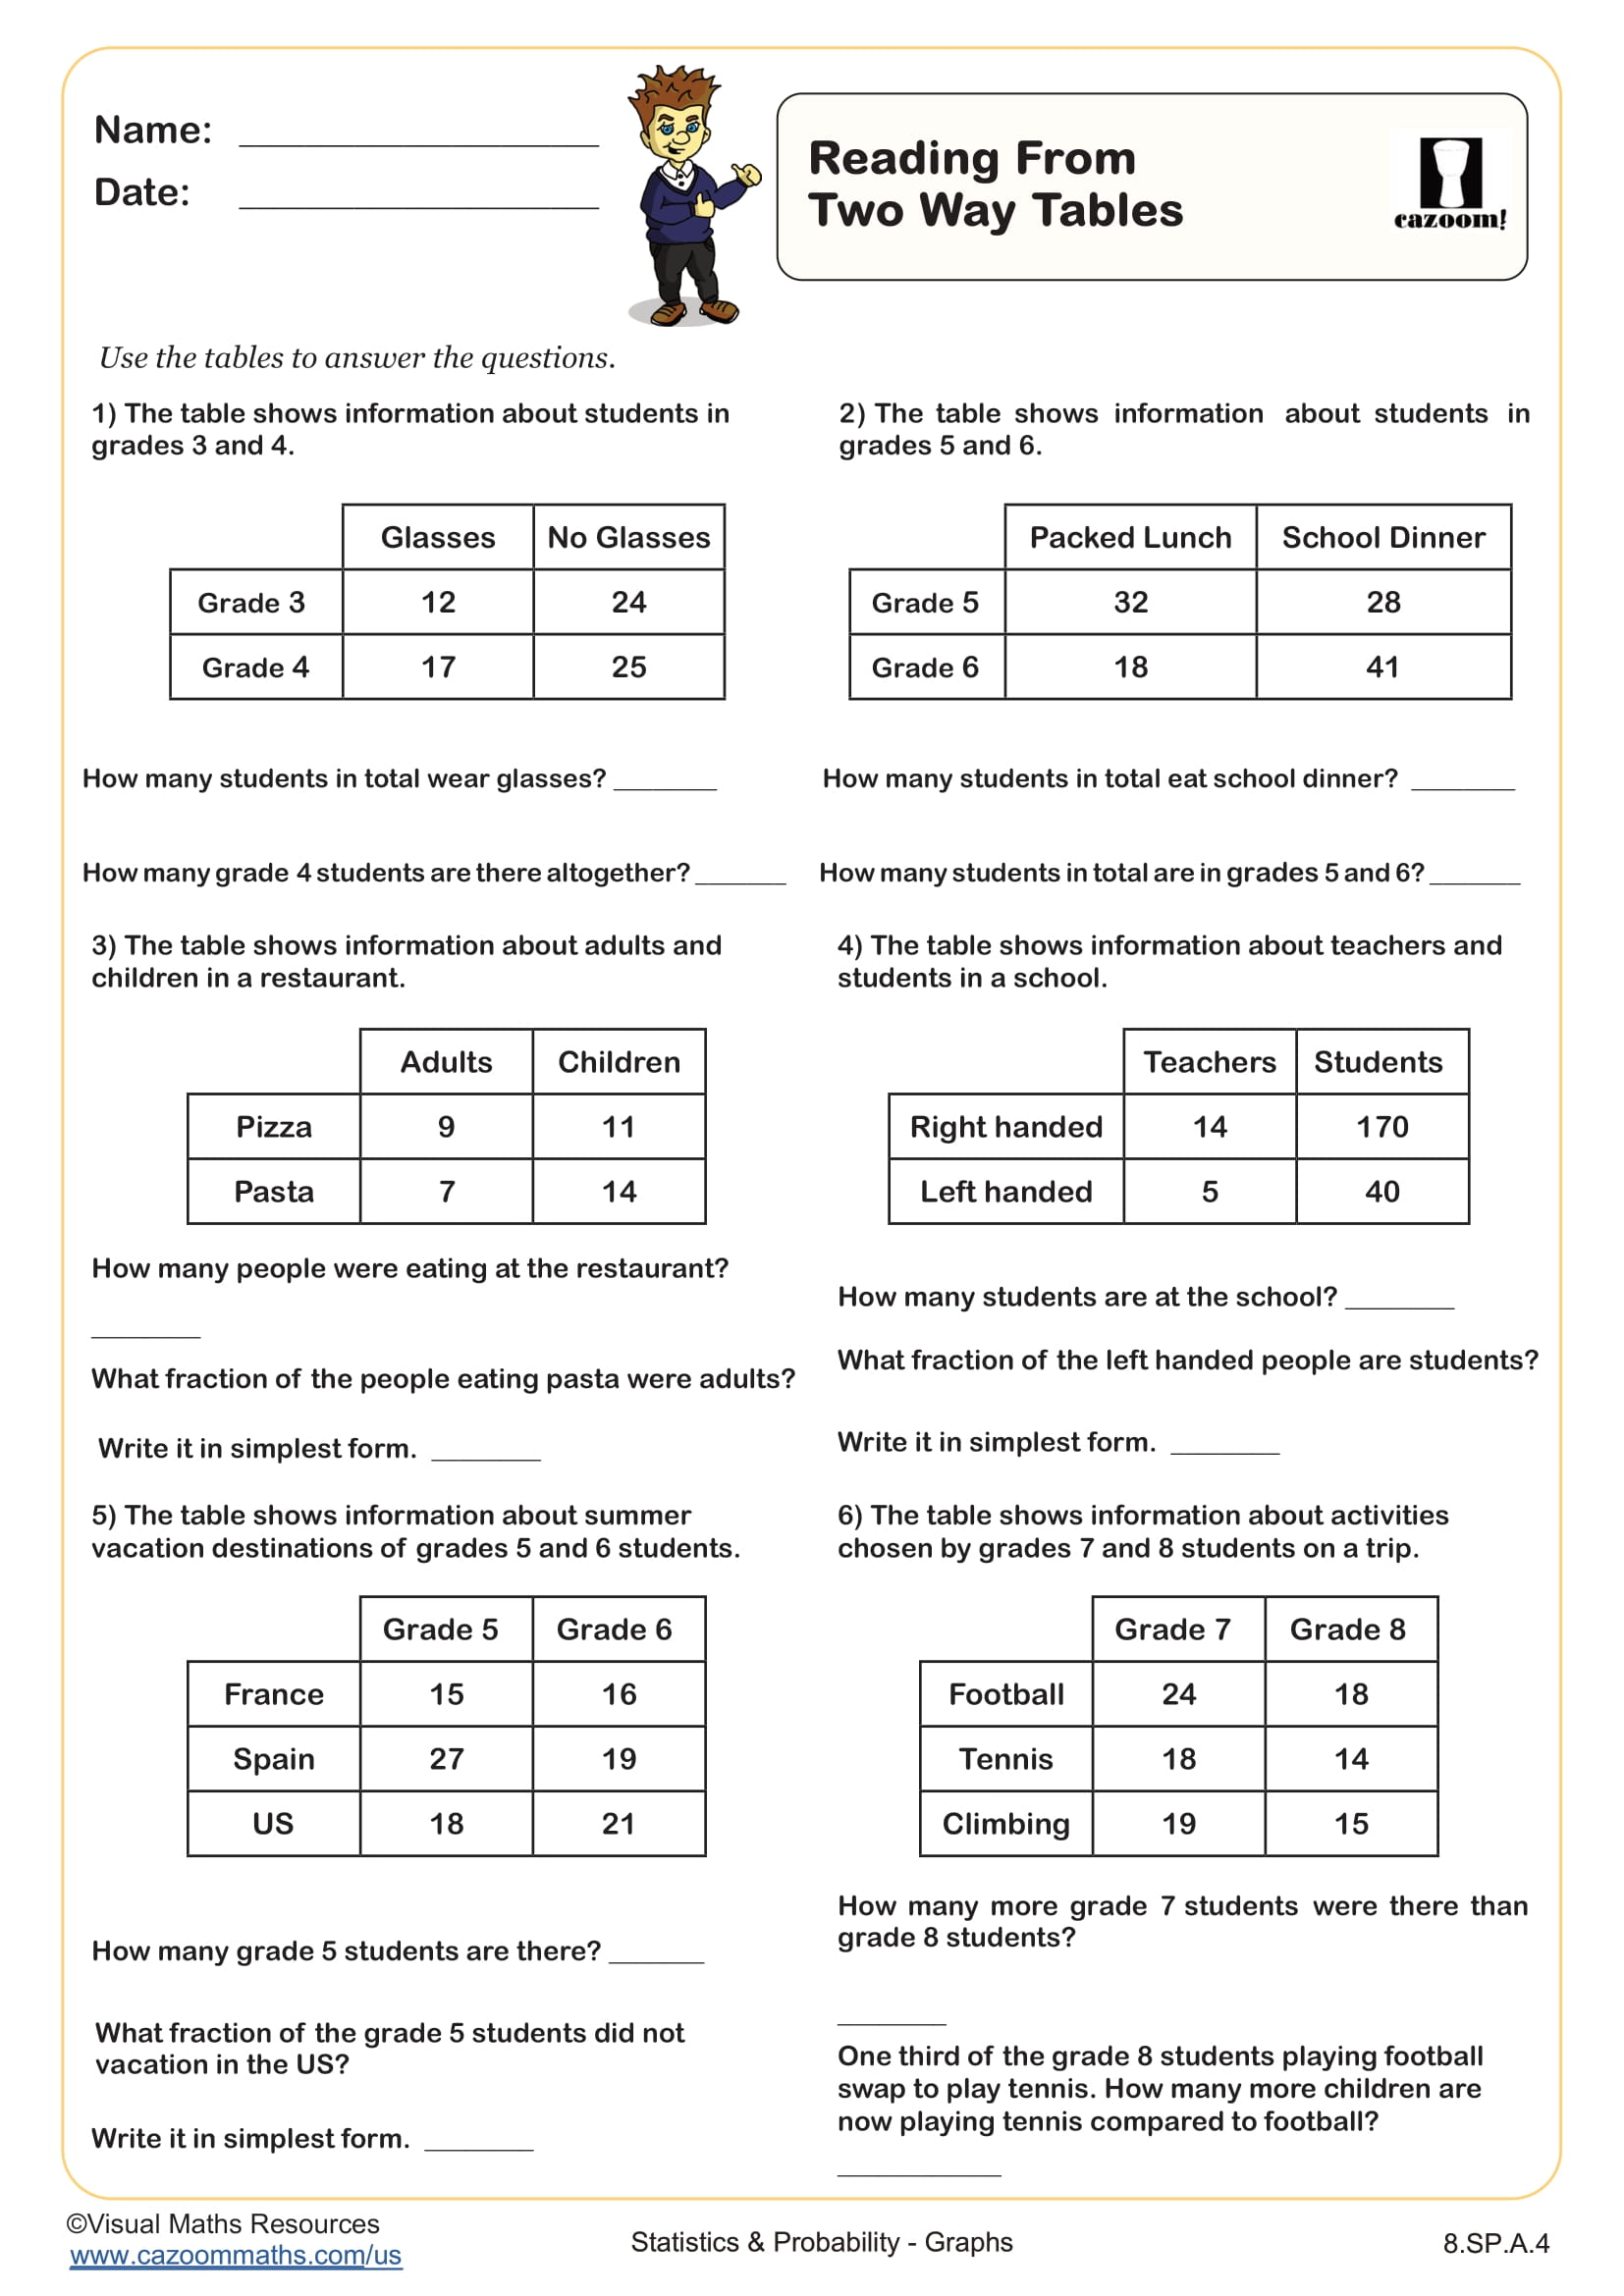
Reading from Two Way Tables
Grades: 8th Grade, IM 1
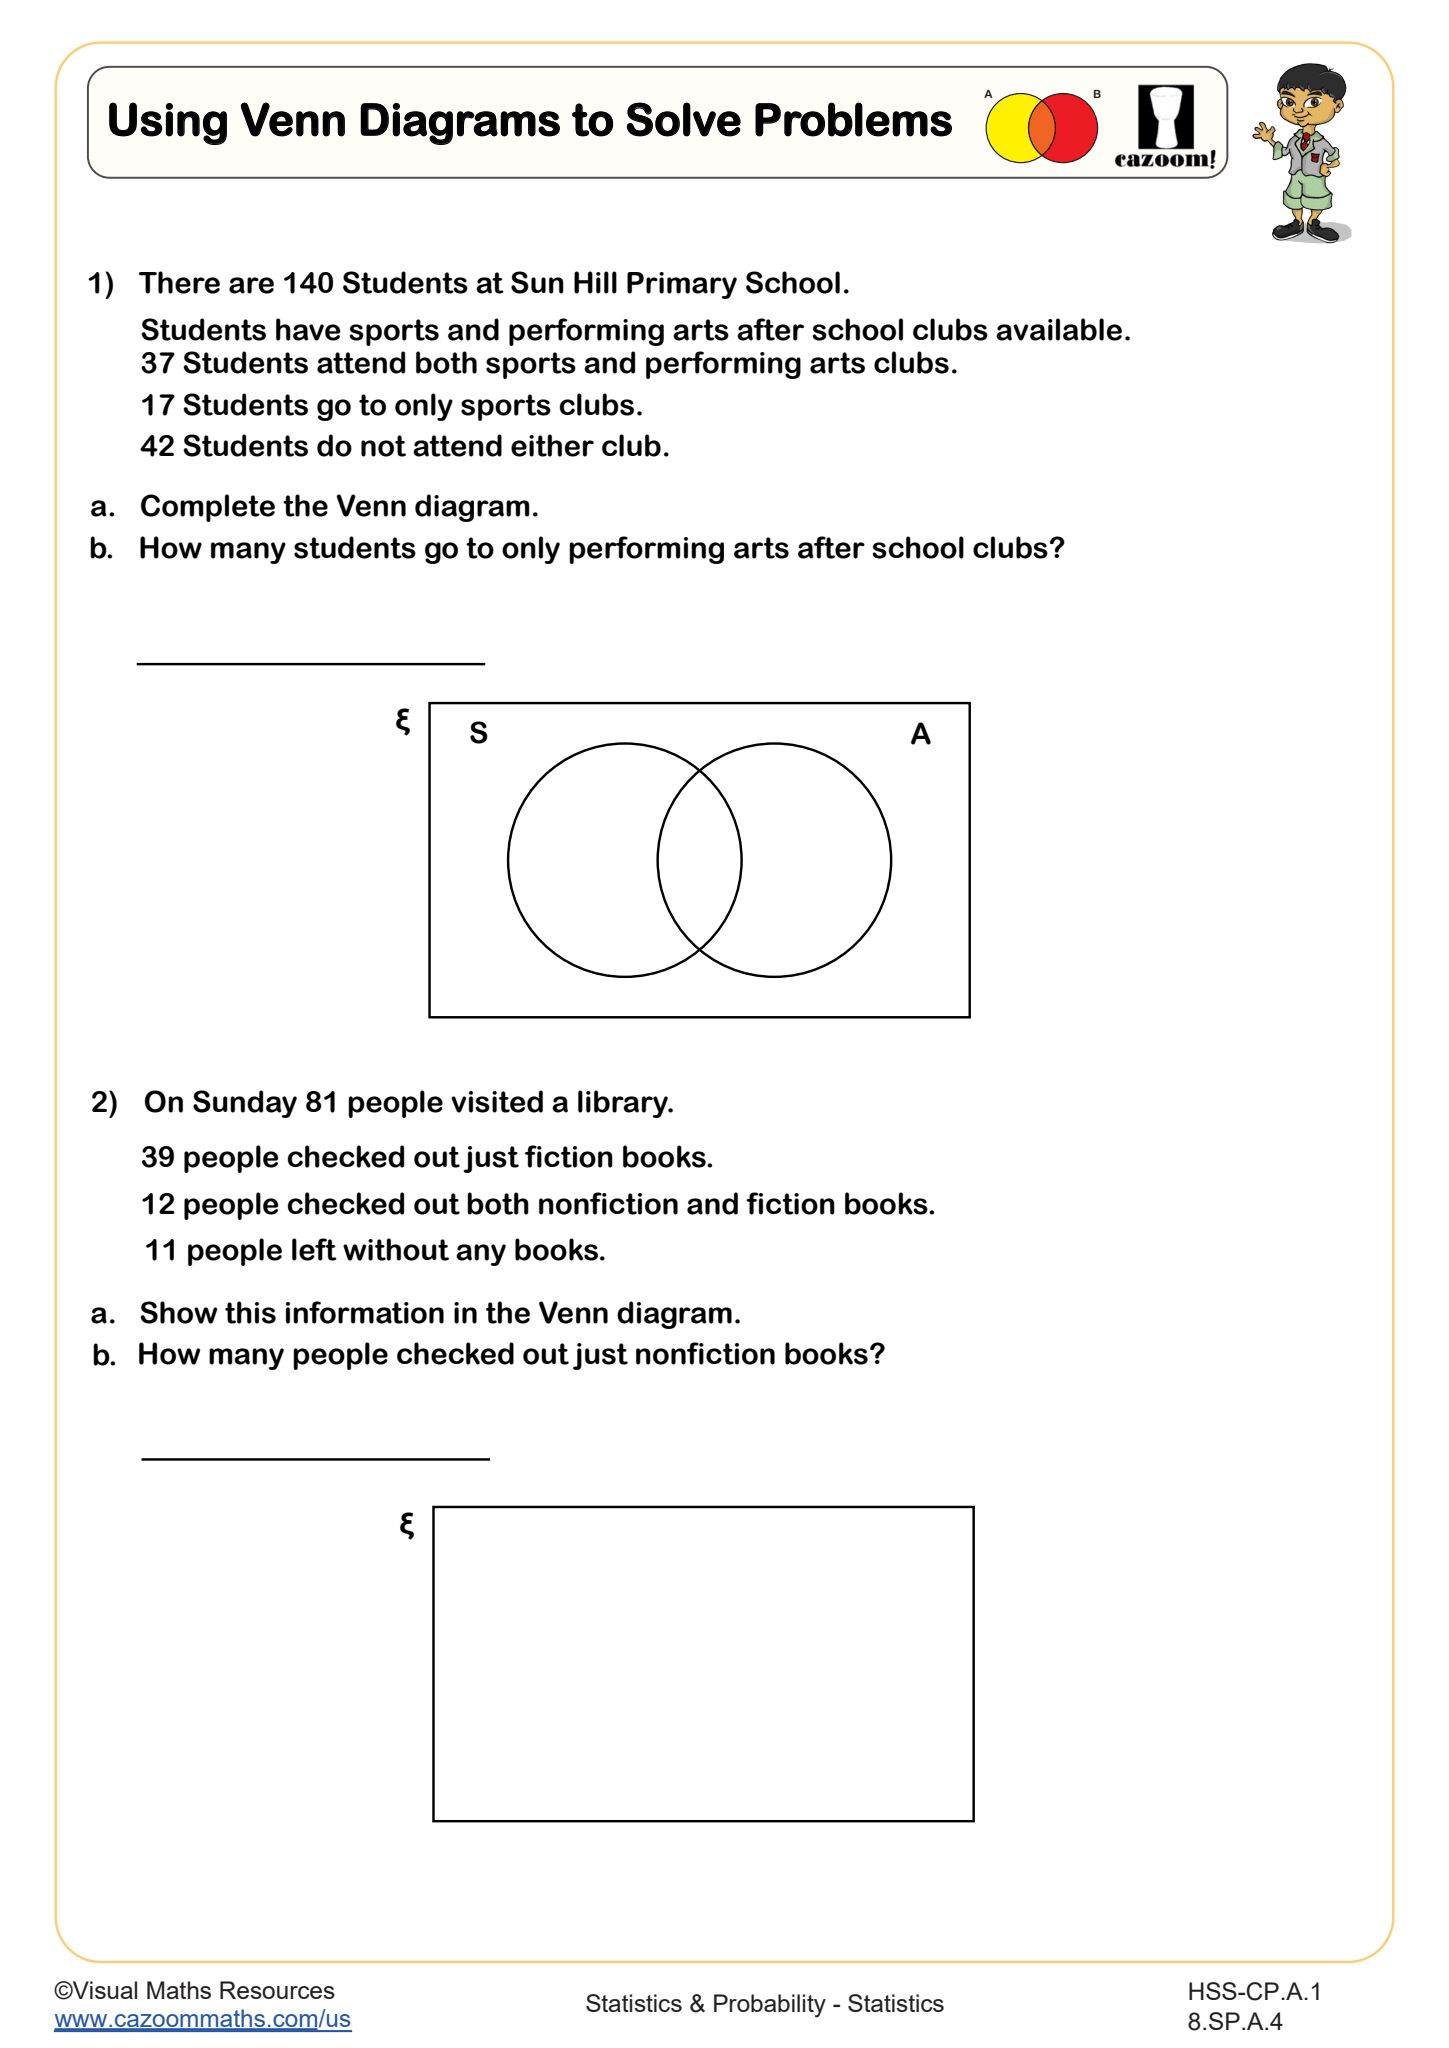
Using Venn Diagrams to Solve Problems
Grades: 8th Grade, Algebra I, IM 1
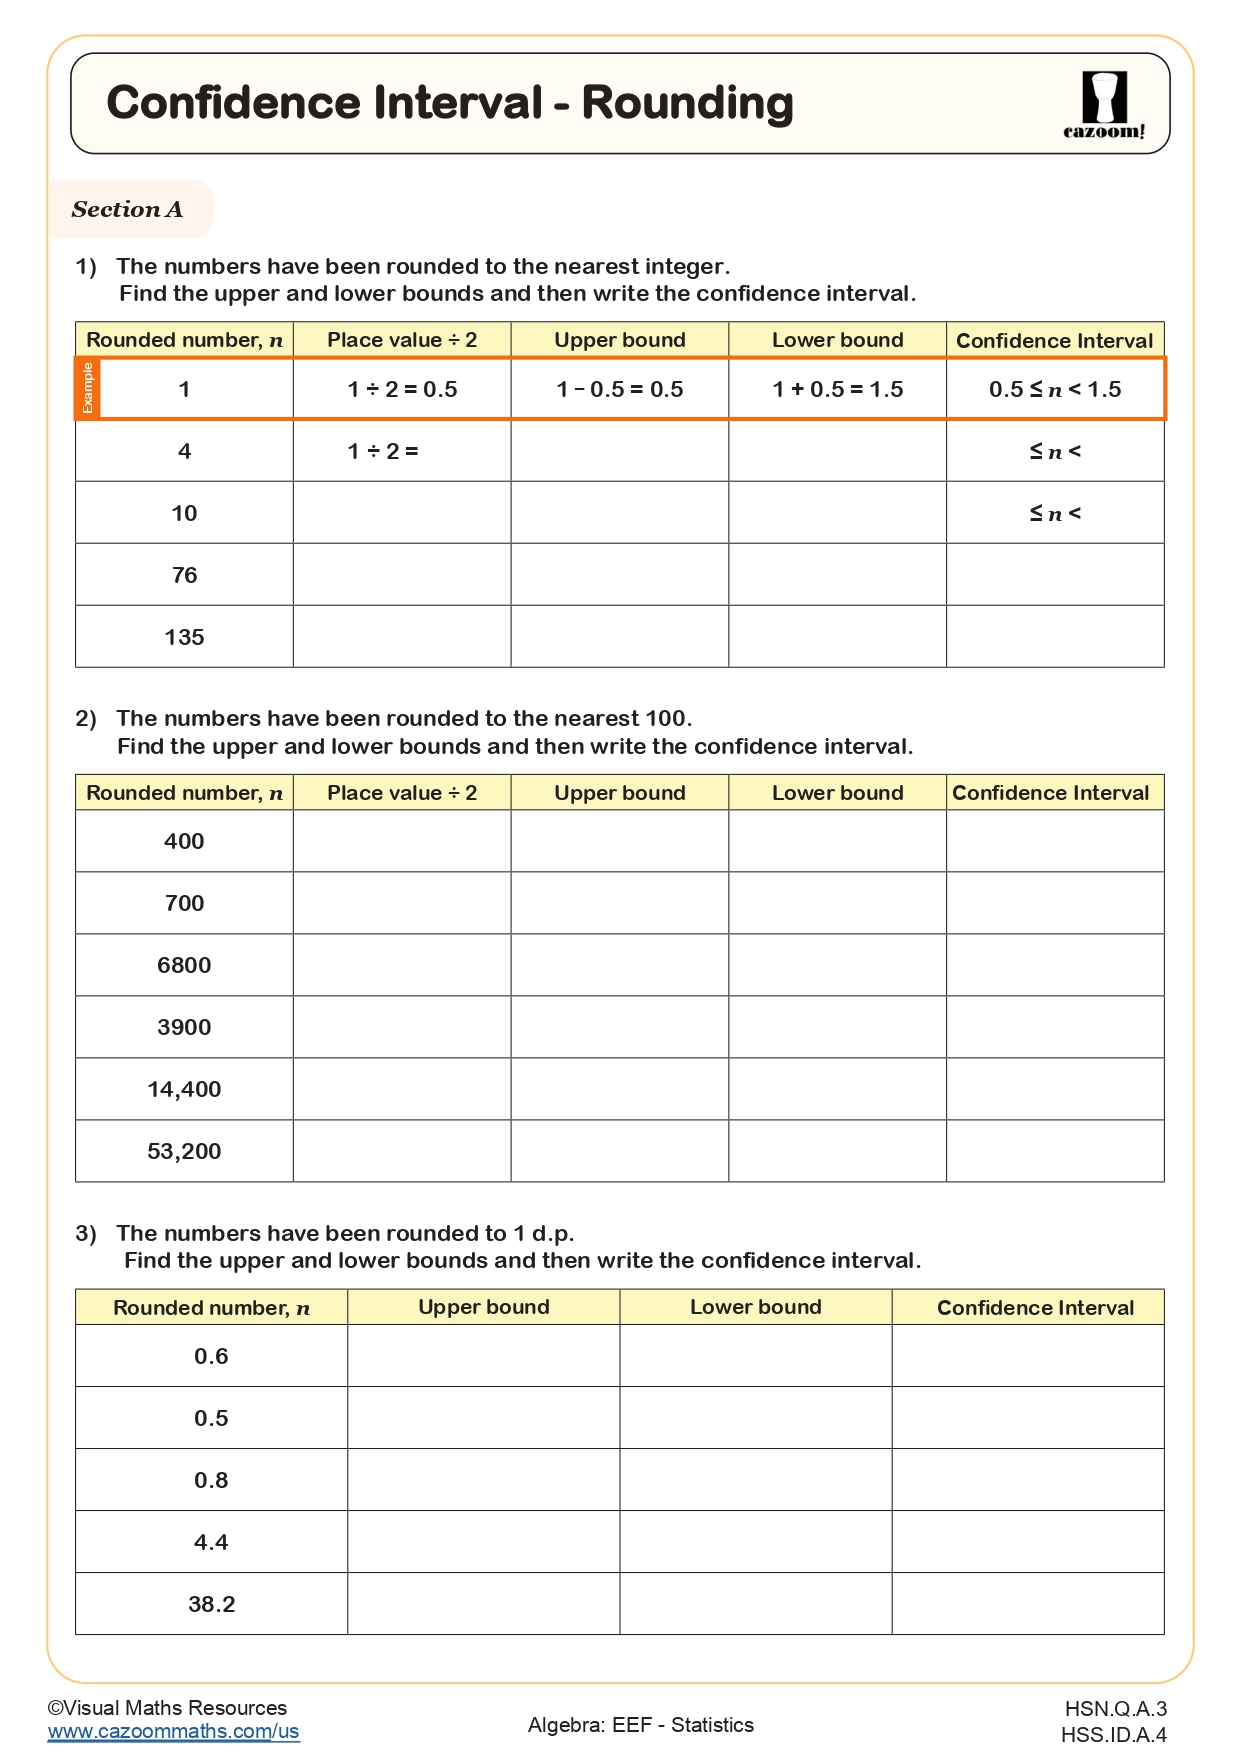
Confidence Interval - Rounding
Grades: Algebra II, IM 2
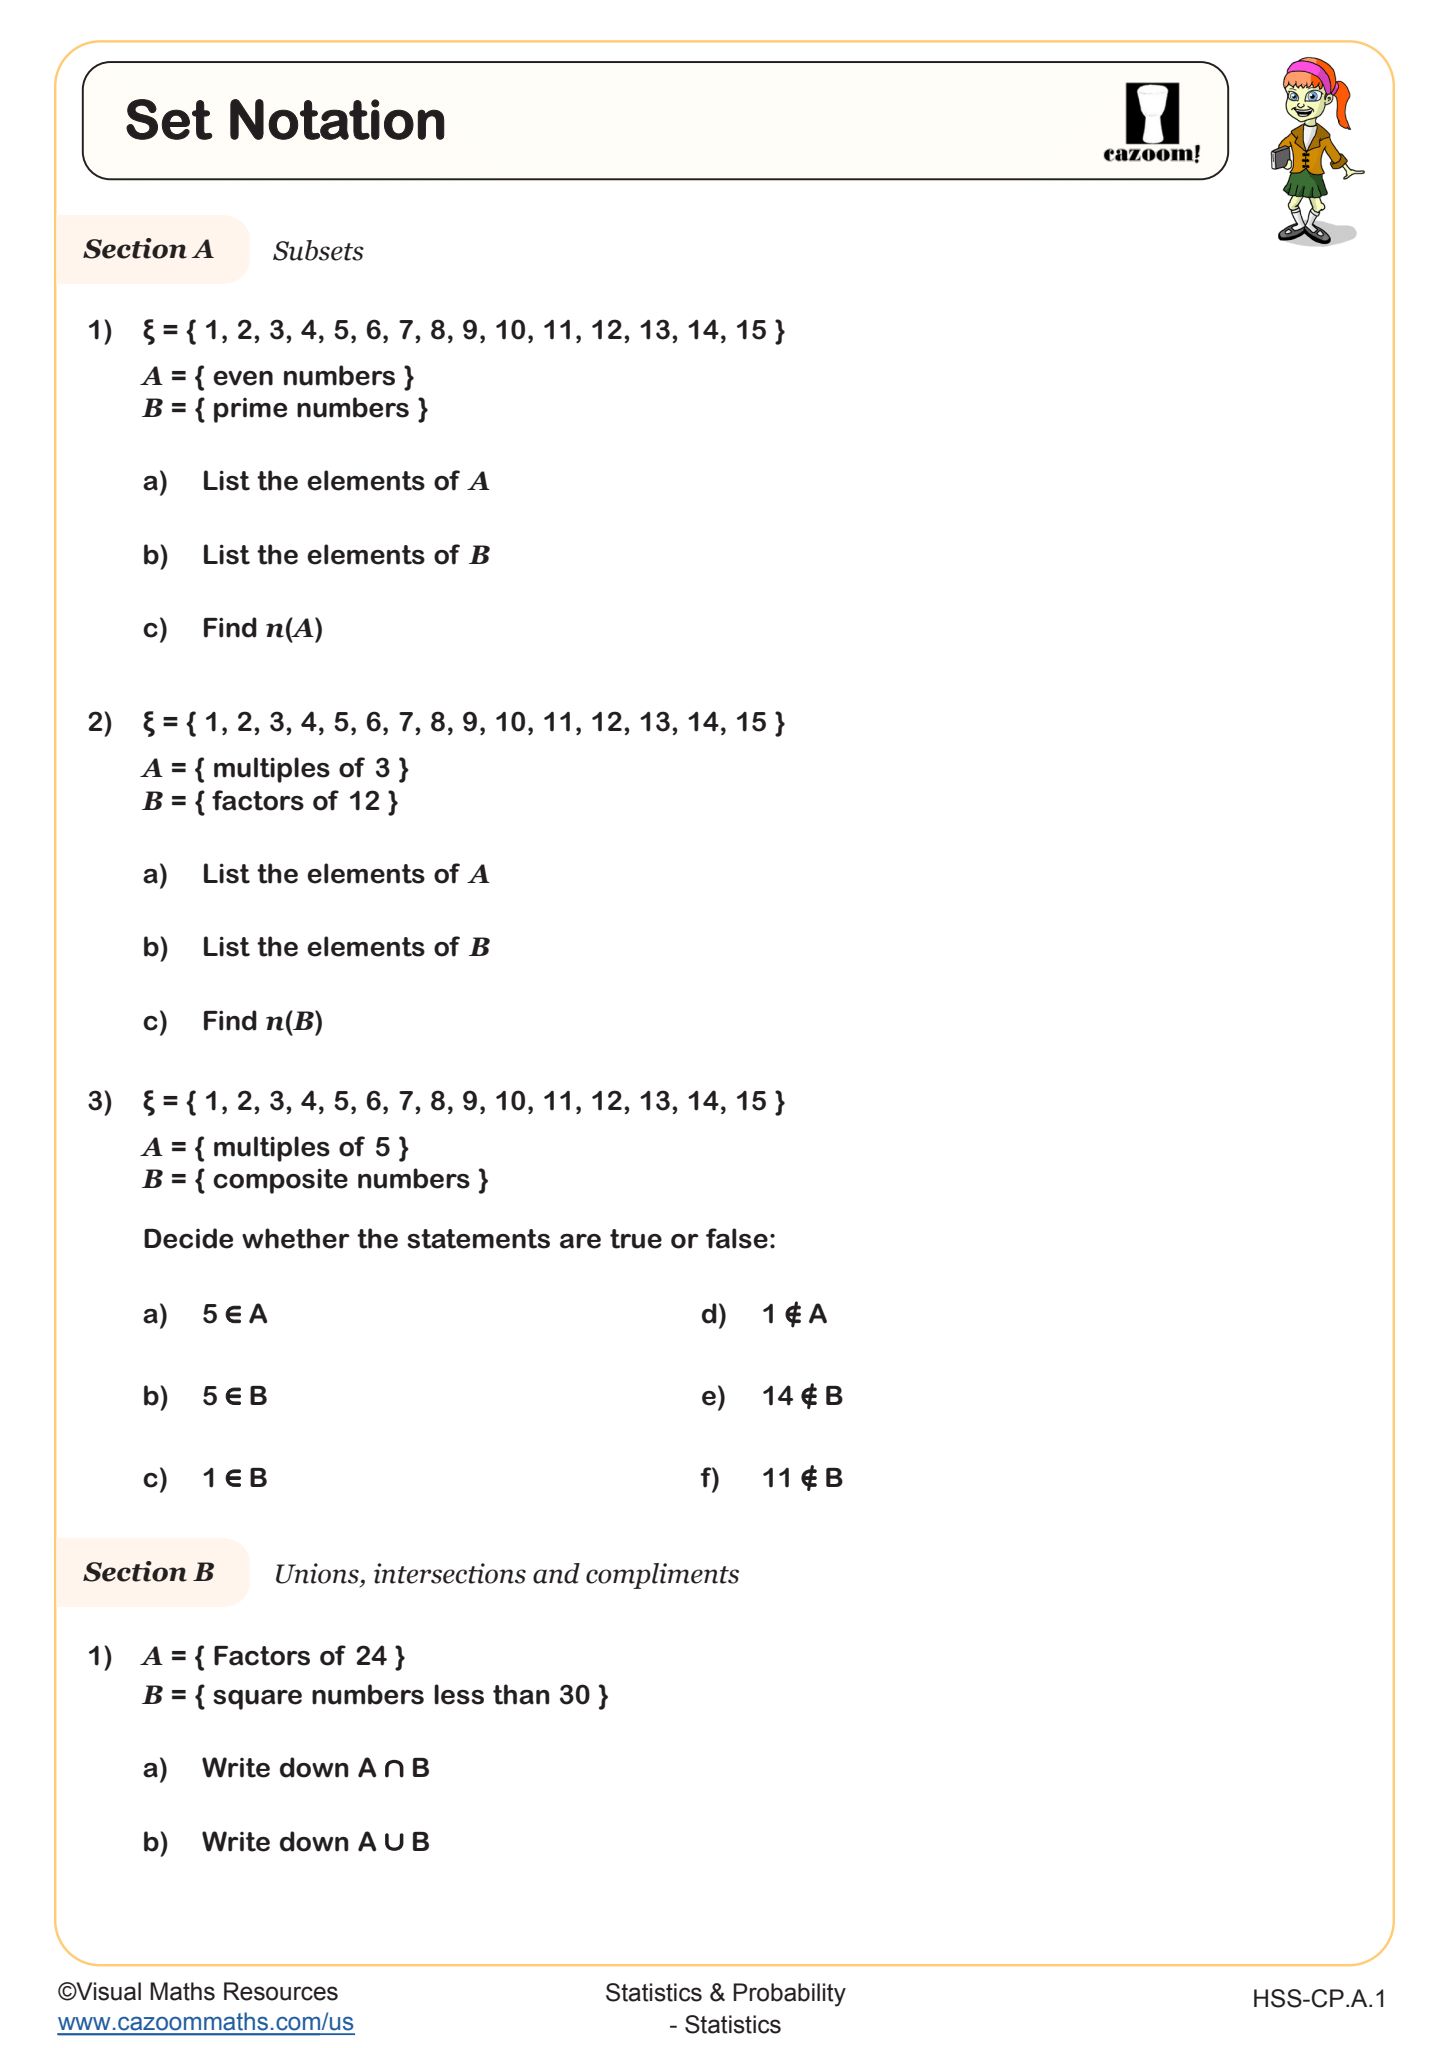
Set Notation
Grades: Algebra II, IM 2
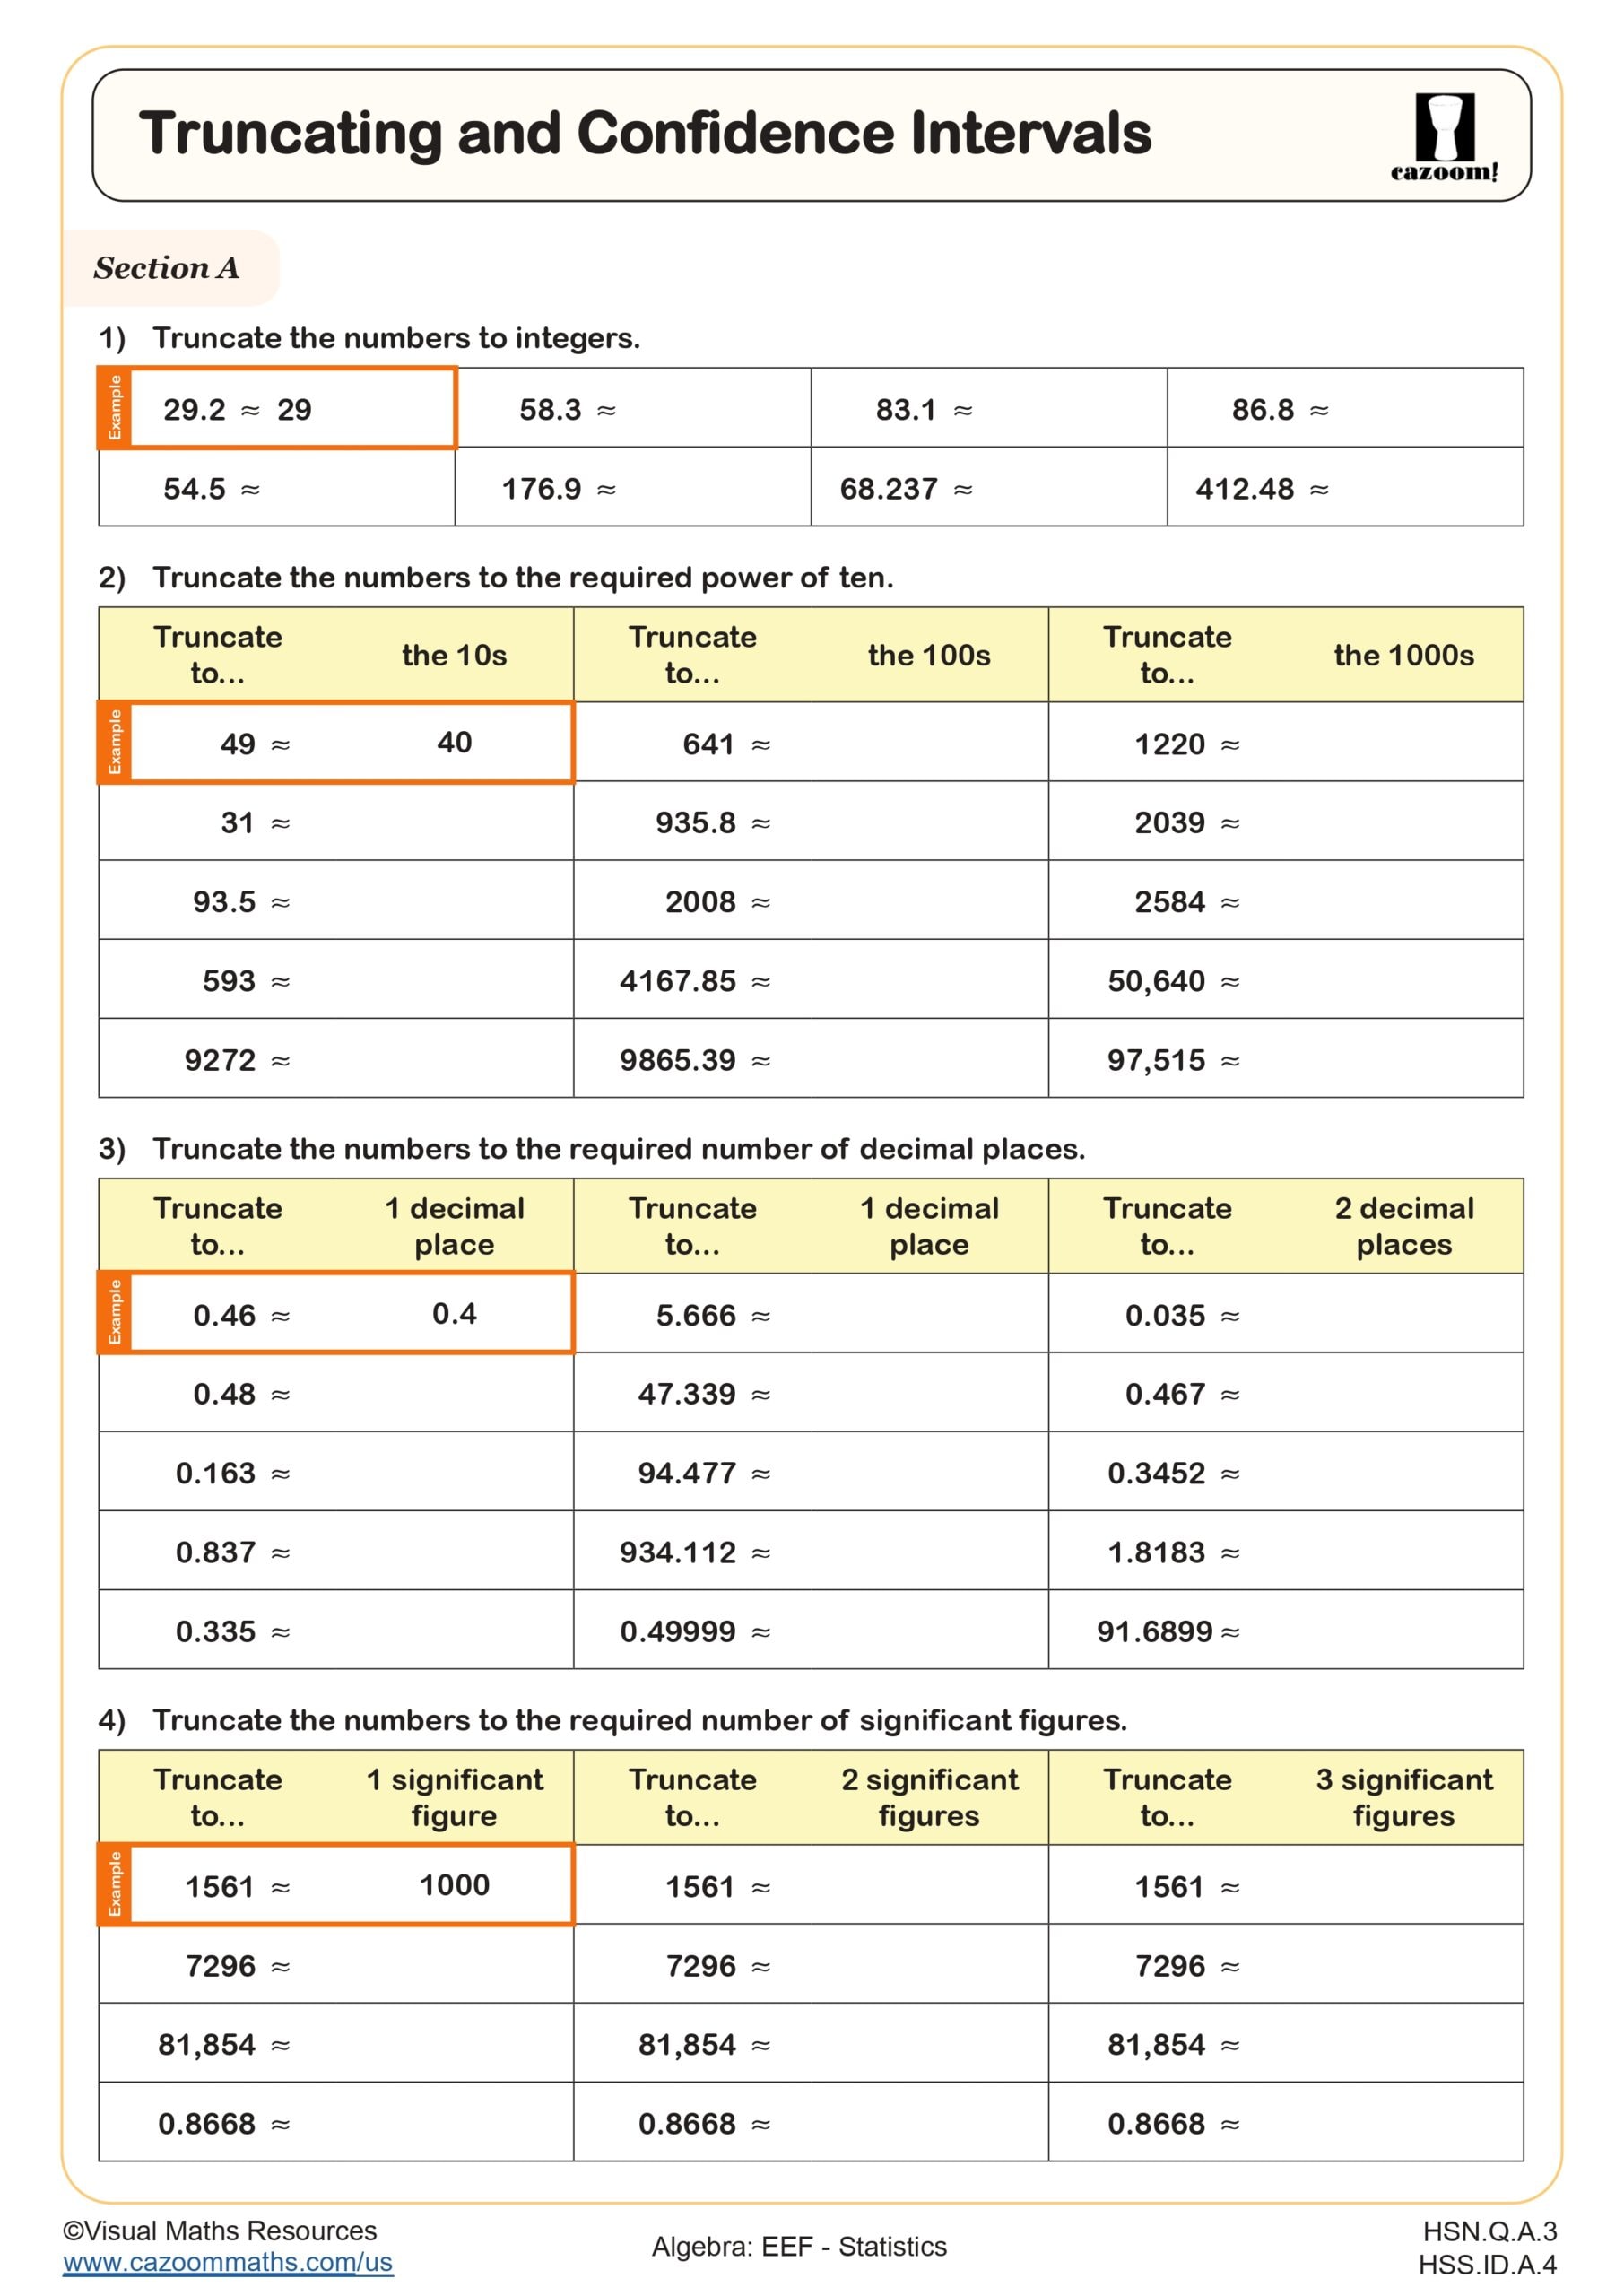
Truncating and Confidence Interval
Grades: Algebra II, IM 2
Printable PDF Statistics Worksheets with Answer Keys
Download our printable PDF statistics worksheet with answers pdf resources to give students the push they need when learning different concepts of statistics equations. Our math experts have specifically curated these resources in a way that your students can master the worksheet using simple statistics equations with clear and easy-to-understand instructions. Hence, our statistics resources are great for building a sense of basic statistical problems, graphs, algebraic equations and early problem-solving skills.
What Is Statistics in Math?
Statistics is the branch of math that deals with collecting, organizing, analyzing, and interpreting data. In school, students learn how to read charts and graphs, calculate averages, and make sense of information using numbers. Statistics helps students understand the world through data—whether it’s comparing test scores, measuring rainfall, or tracking survey results. It’s also a vital part of science, business, and decision-making in everyday life.
Benefits of Learning with Our Statistics Worksheets
Using our statistics worksheets helps students:
• Develop strong data-handling and graph-reading skills
• Learn to calculate and compare averages
• Improve understanding of probability and prediction
• Analyze patterns and trends in real data
• Prepare for math assessments and standardized tests
Our worksheets feature simple layouts, step-by-step tasks, and real-life examples to make math engaging and meaningful.
Real-Life Uses of Statistics
Statistics is everywhere—in science labs, sports scoreboards, classrooms, and news articles. Students use statistics to understand survey results, track goals, and compare data over time. Whether they’re analyzing class test results or interpreting weather data, statistics gives them the tools to ask questions and find answers. Our worksheets use real-life scenarios to show how math applies to everyday decisions and problem-solving.
What Should Students Know Before Learning Statistics?
Before starting with statistics worksheets, students should:
• Be confident in basic operations (add, subtract, multiply, divide)
• Understand how to read and draw tables and charts
• Be able to organize data in simple groups
• Recognize number patterns and use logical reasoning
These basic math skills help students better understand how to work with data and solve real-world math problems.