Real Life Graphs Worksheets With Answers
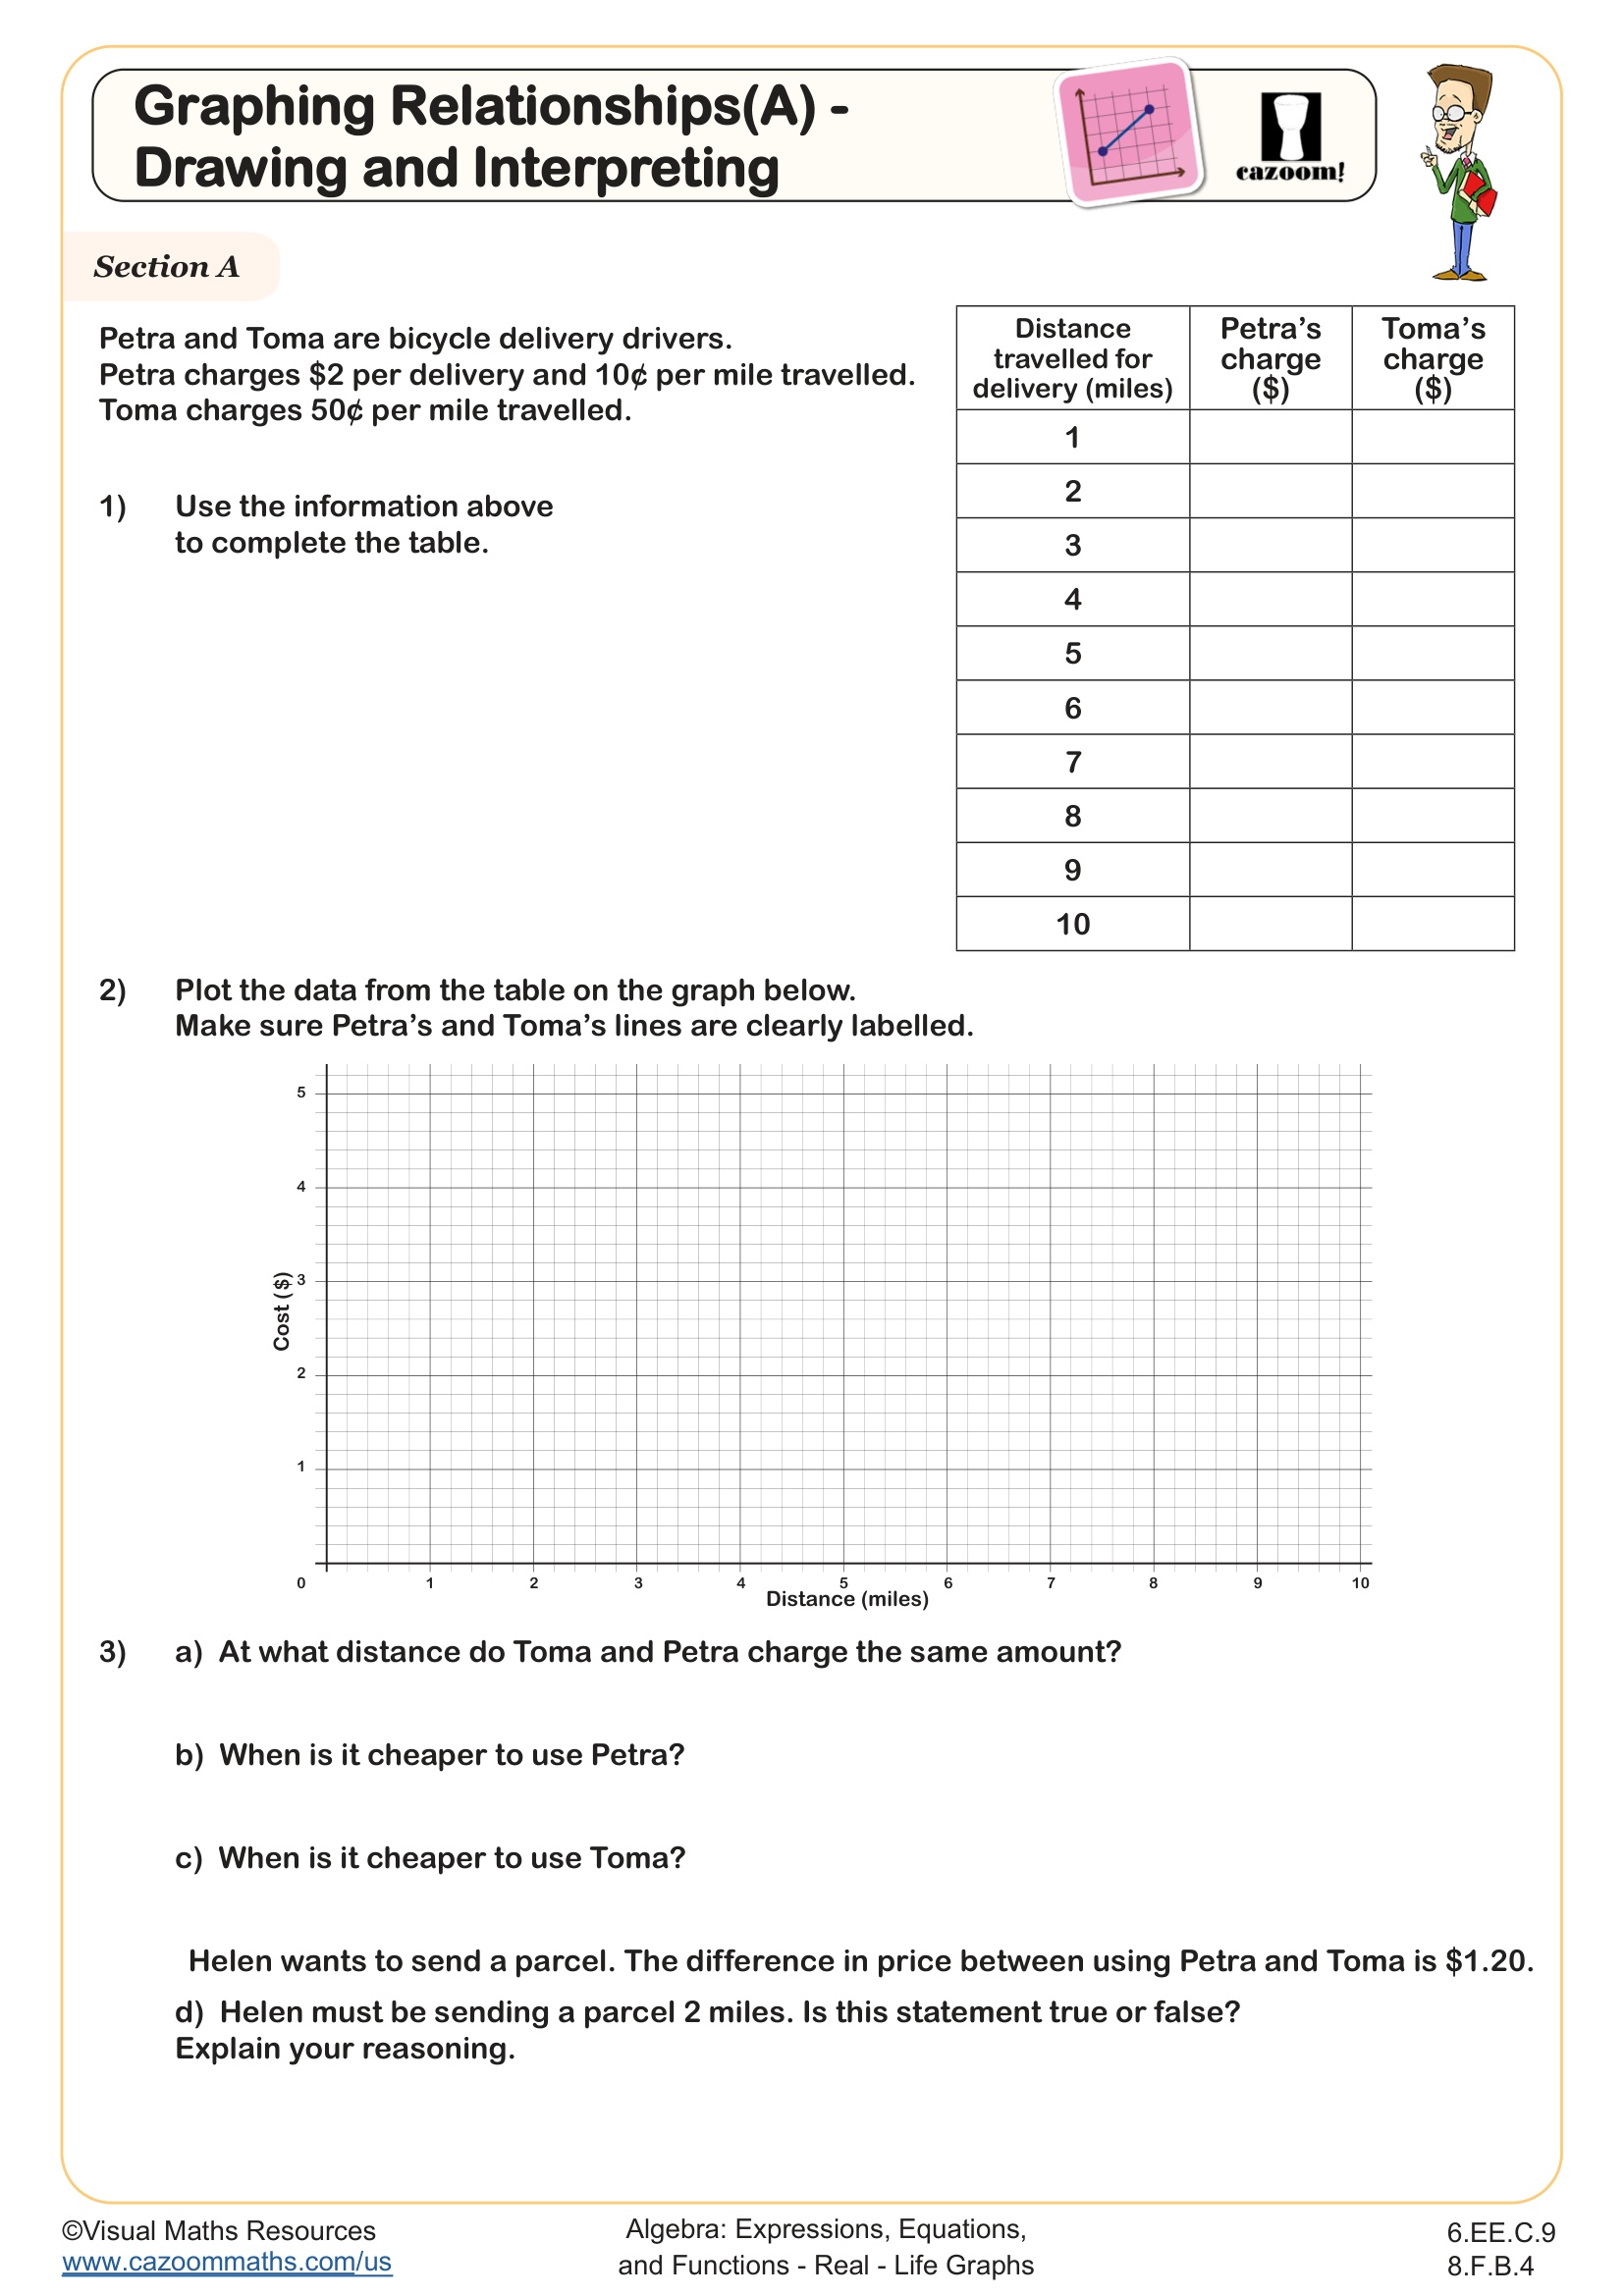
Graphing Relationships (A) - Drawing and Interpreting
Grades: 6th Grade, 8th Grade
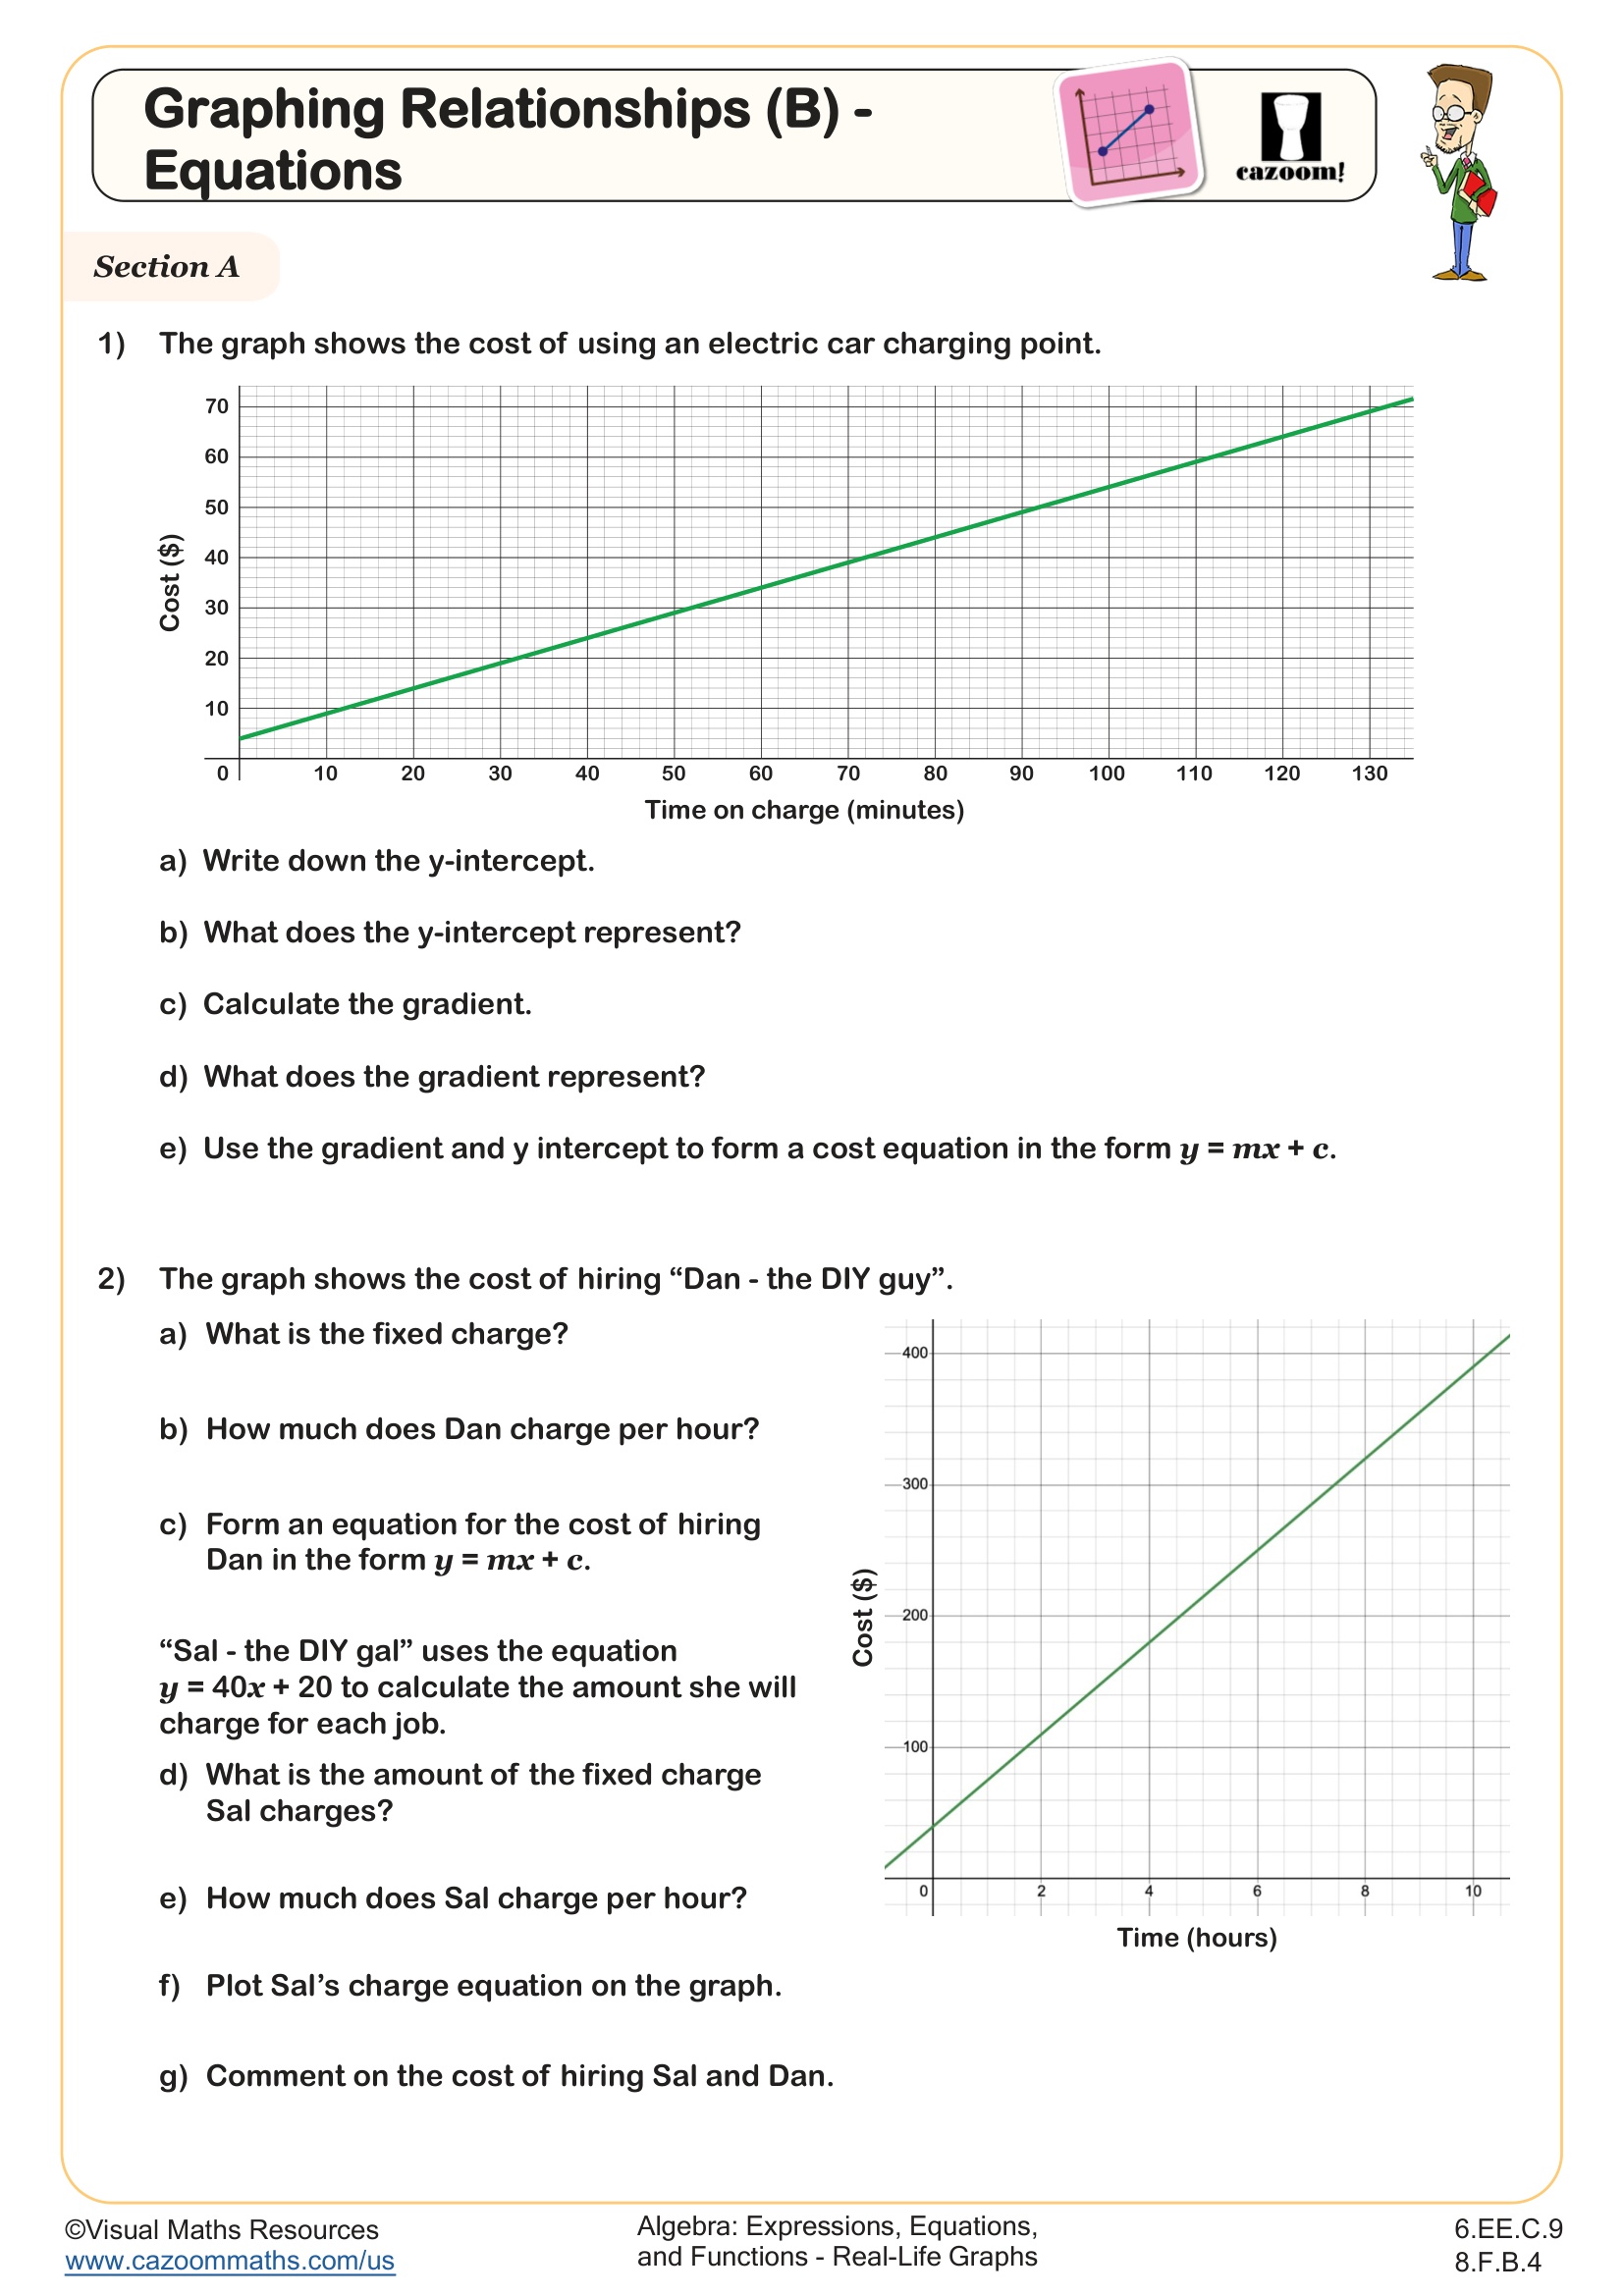
Graphing Relationships (B) - Equations
Grades: 6th Grade, 8th Grade
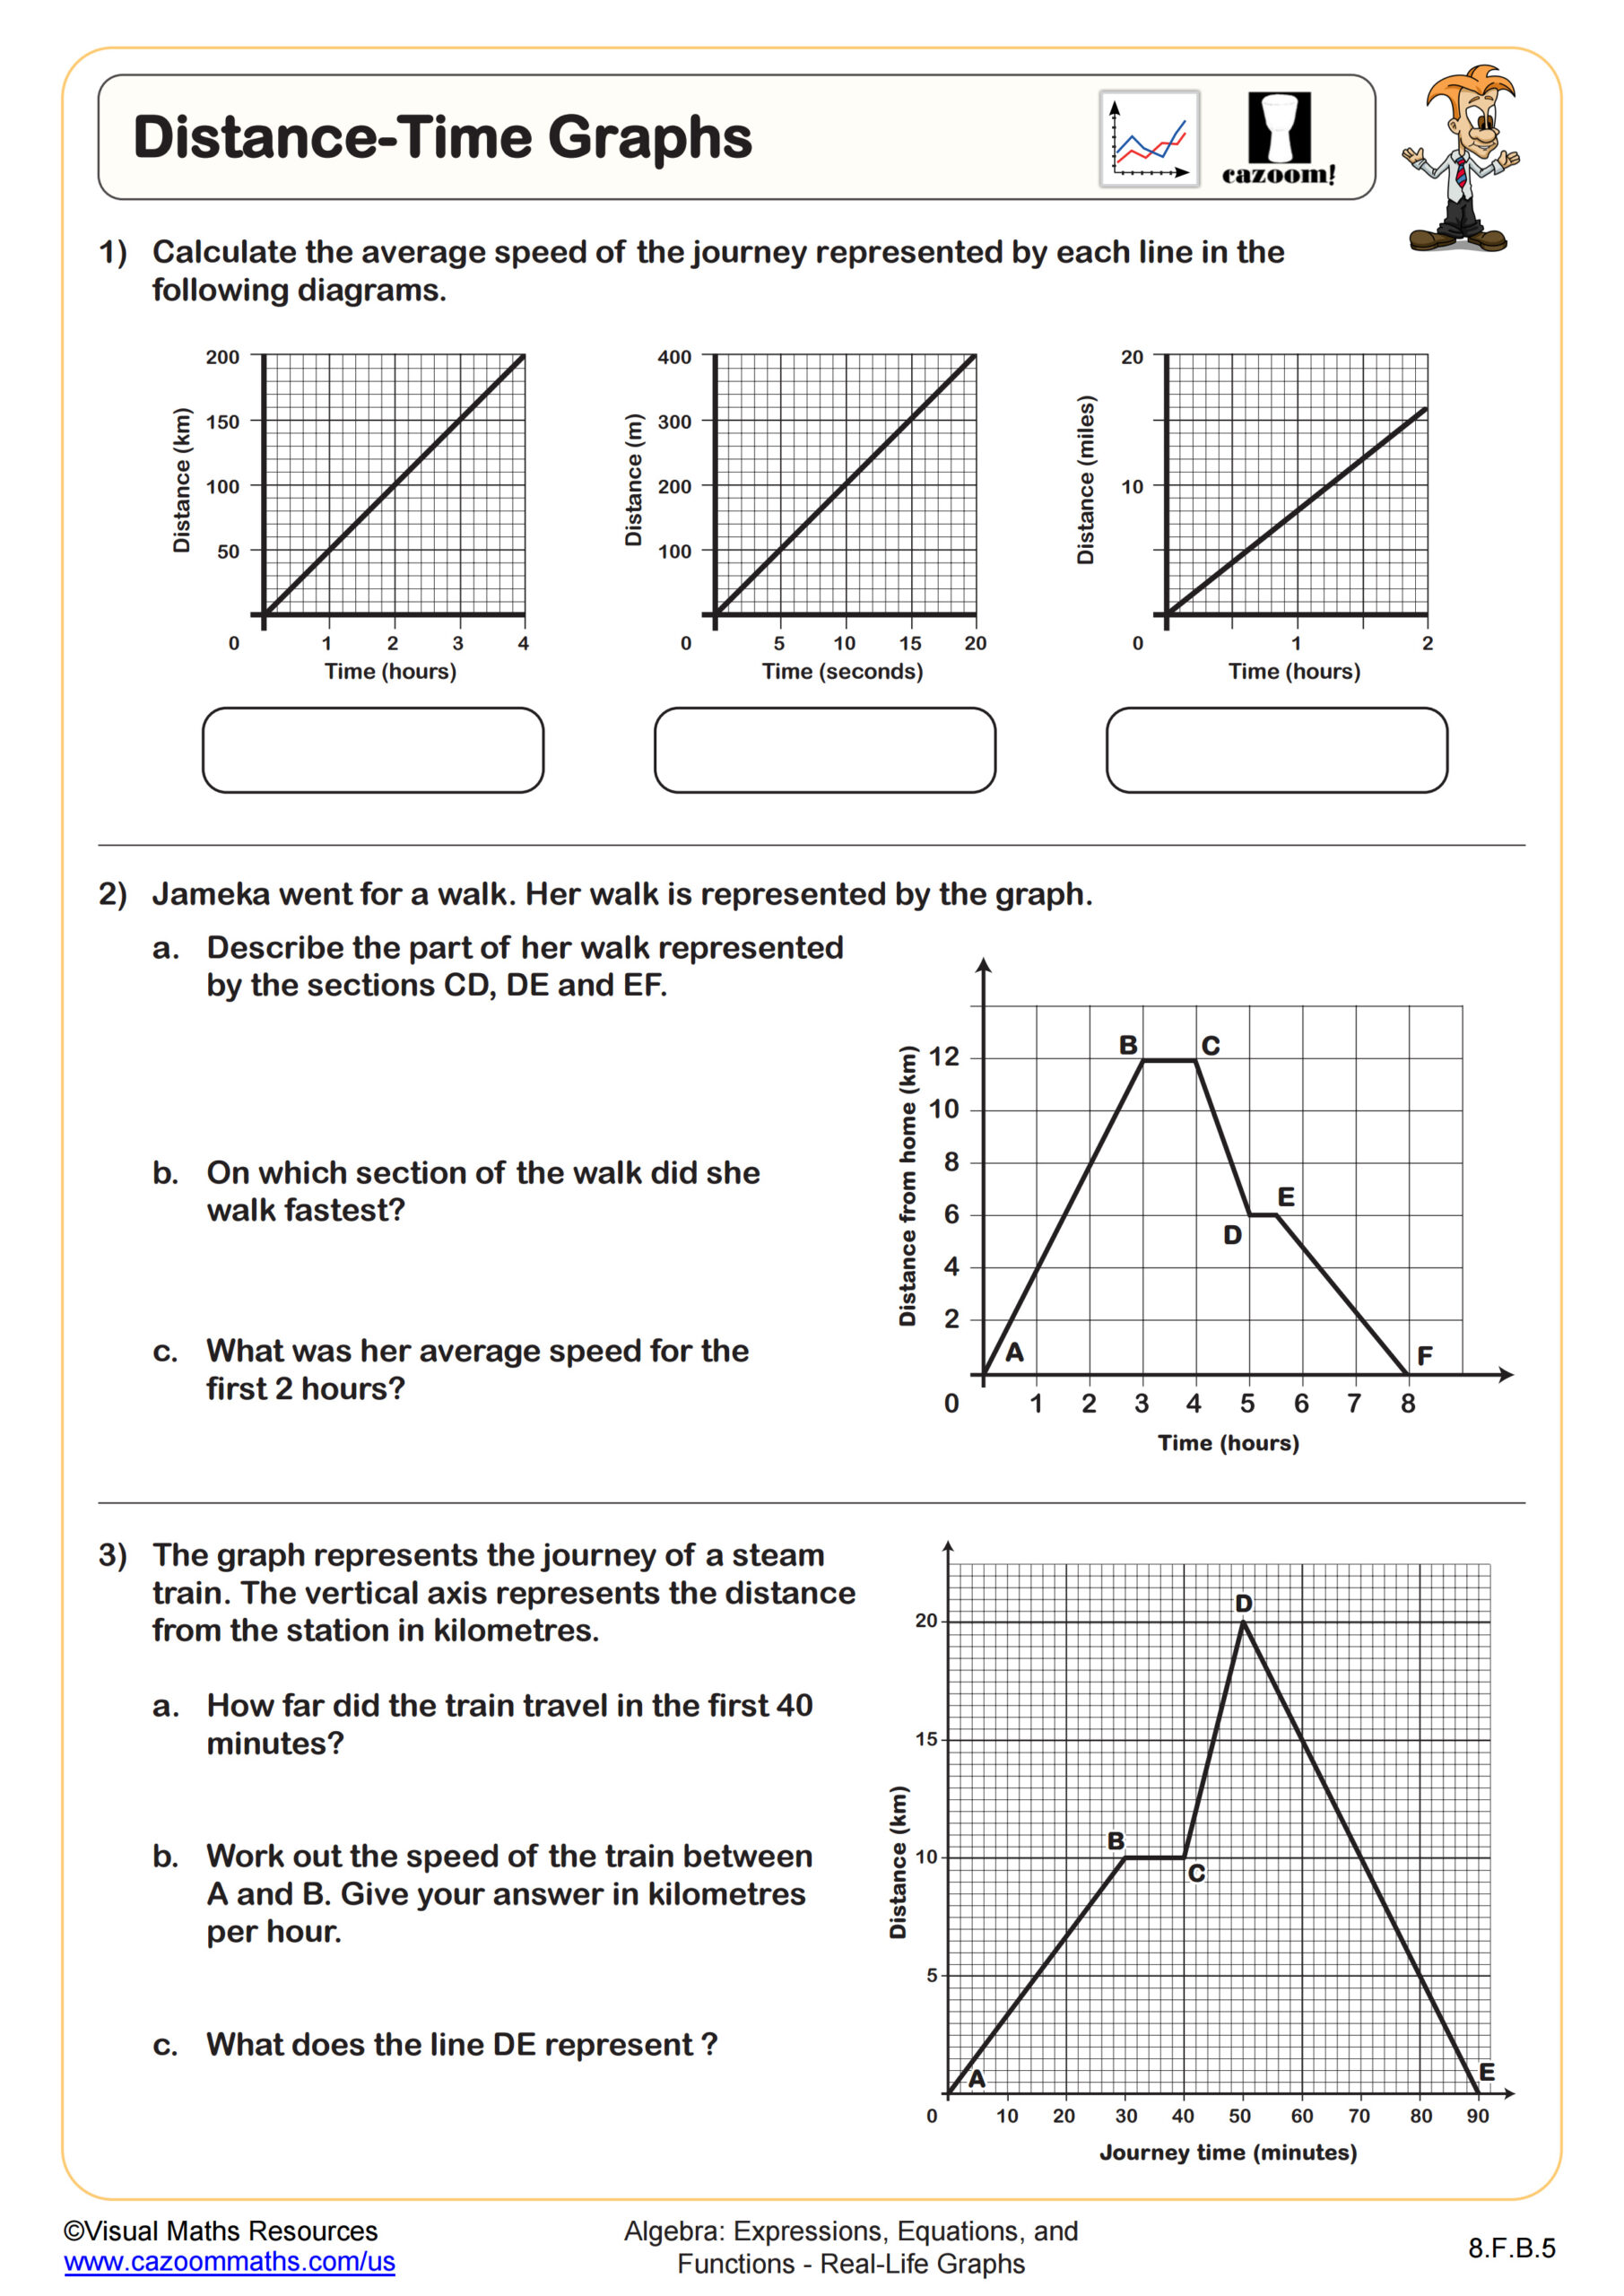
Distance-Time Graphs
Grades: 8th Grade
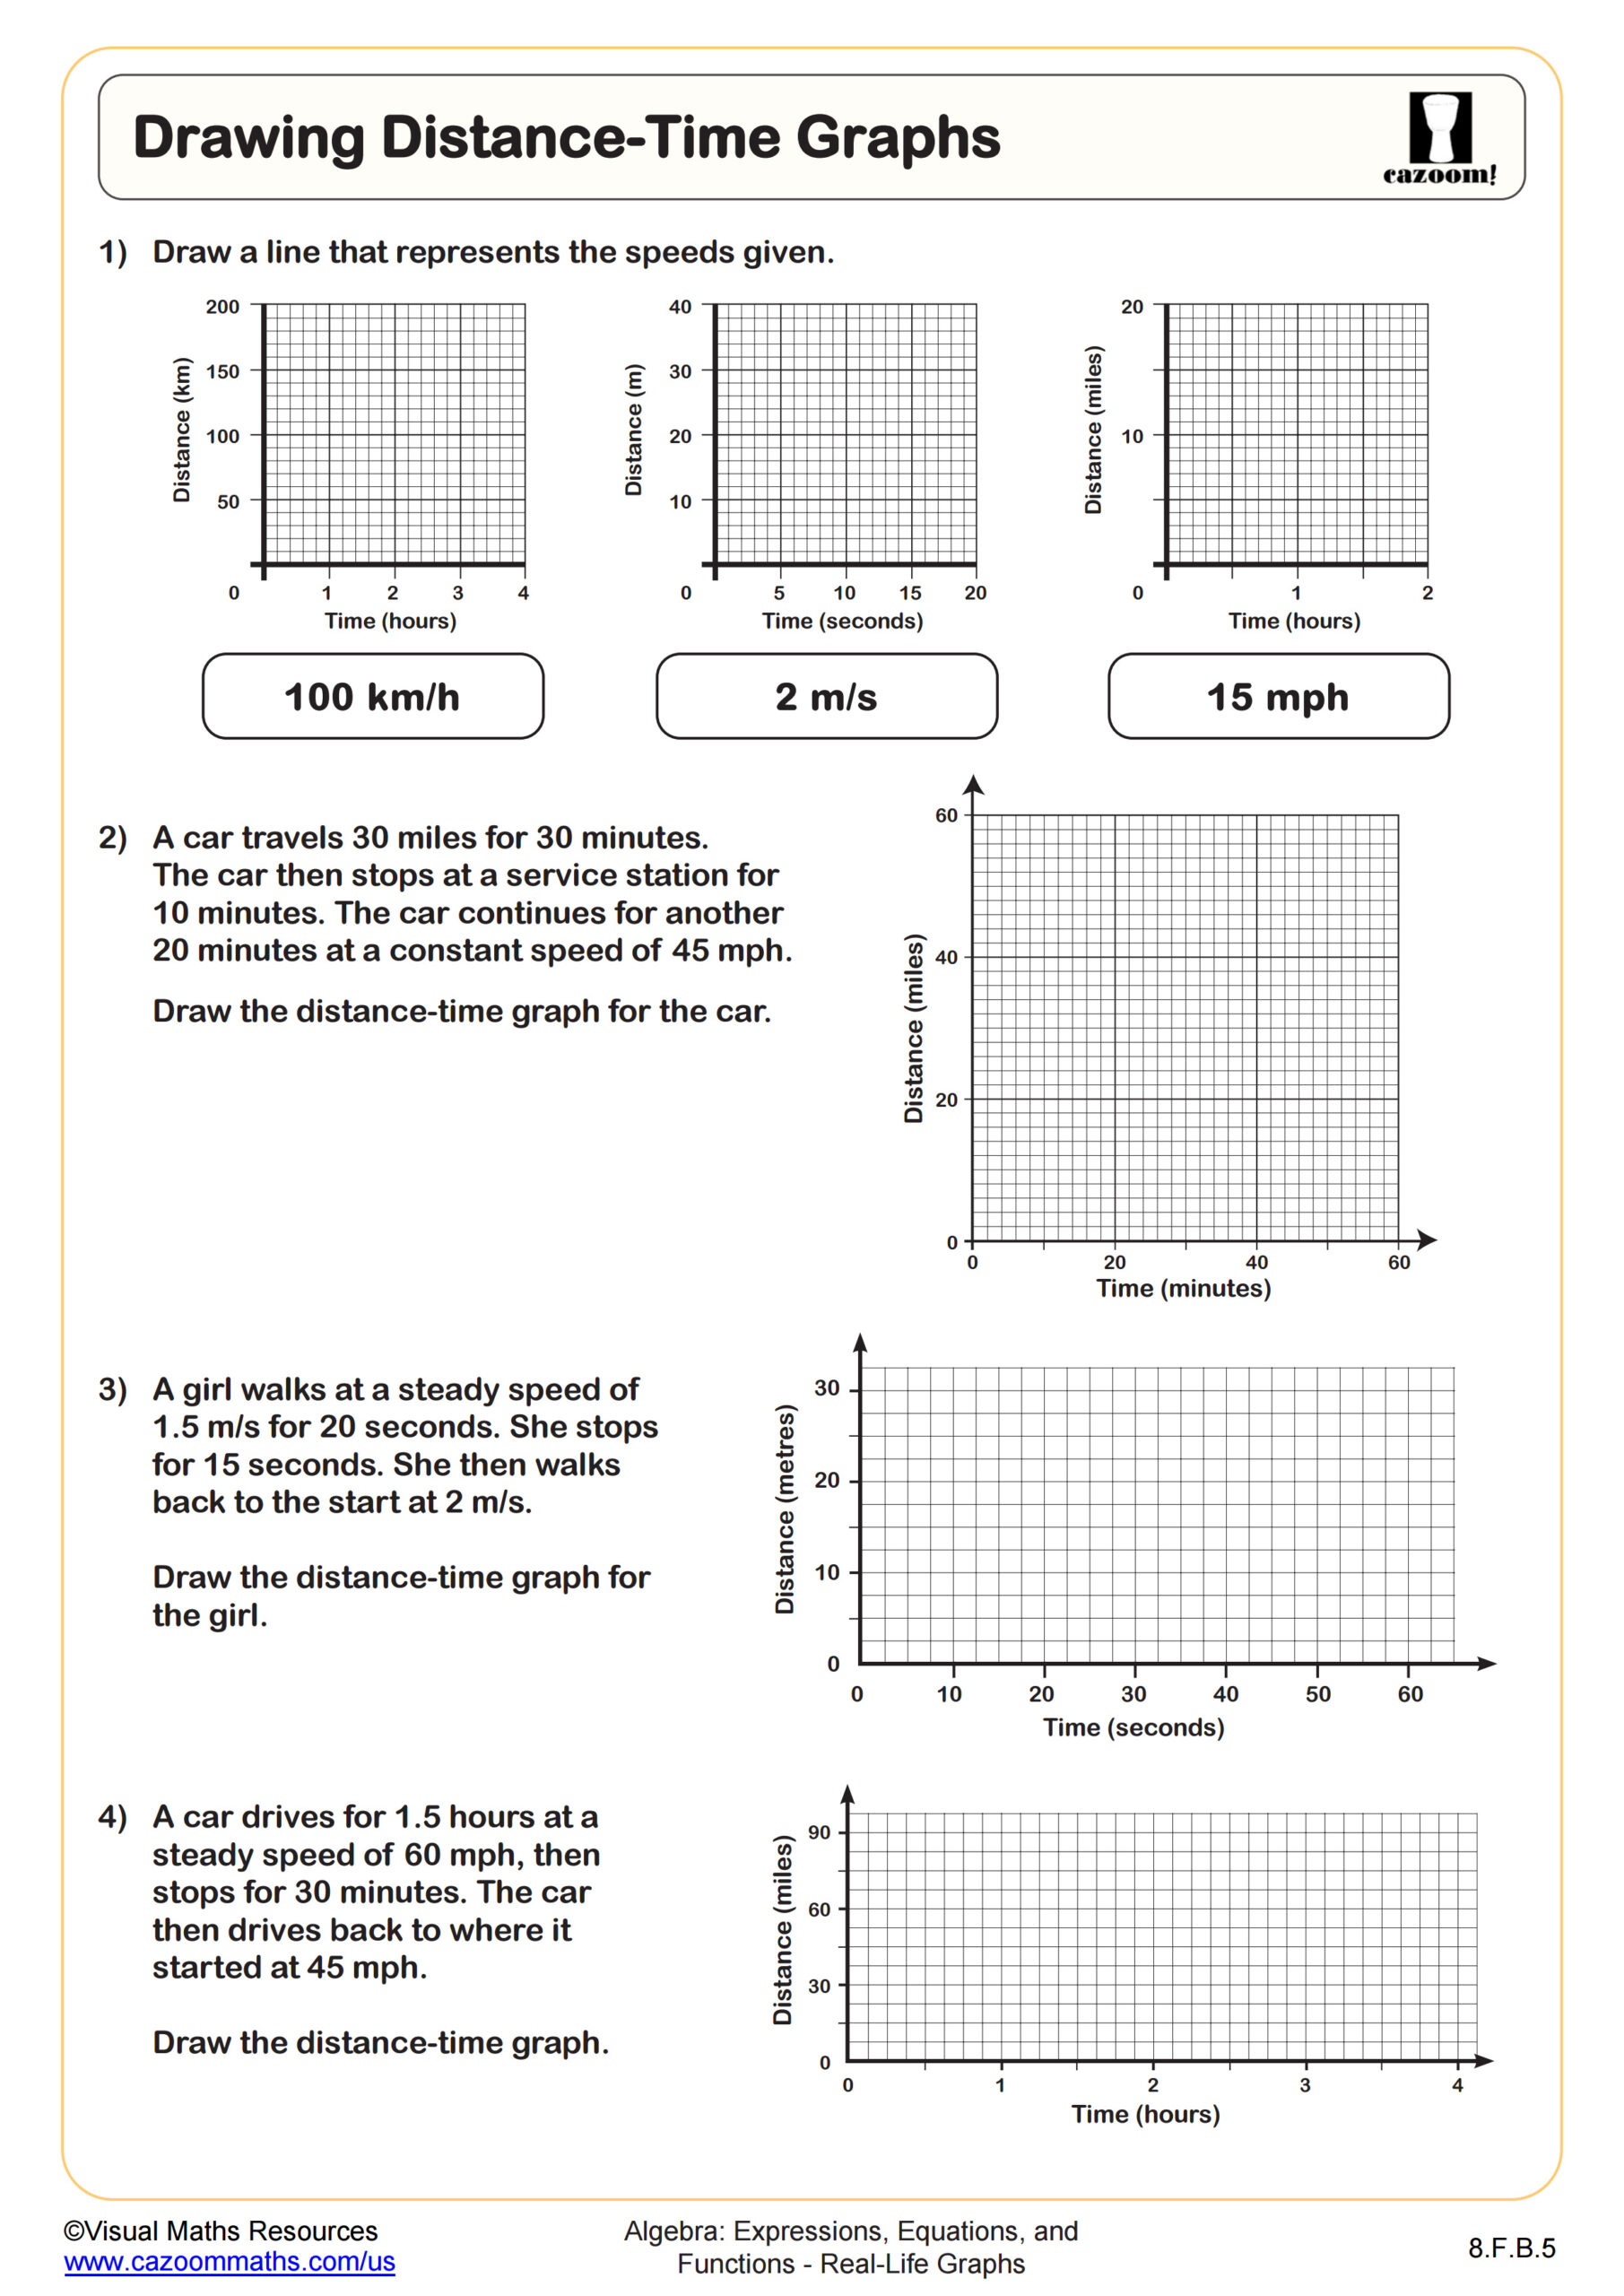
Drawing Distance-Time Graphs
Grades: 8th Grade
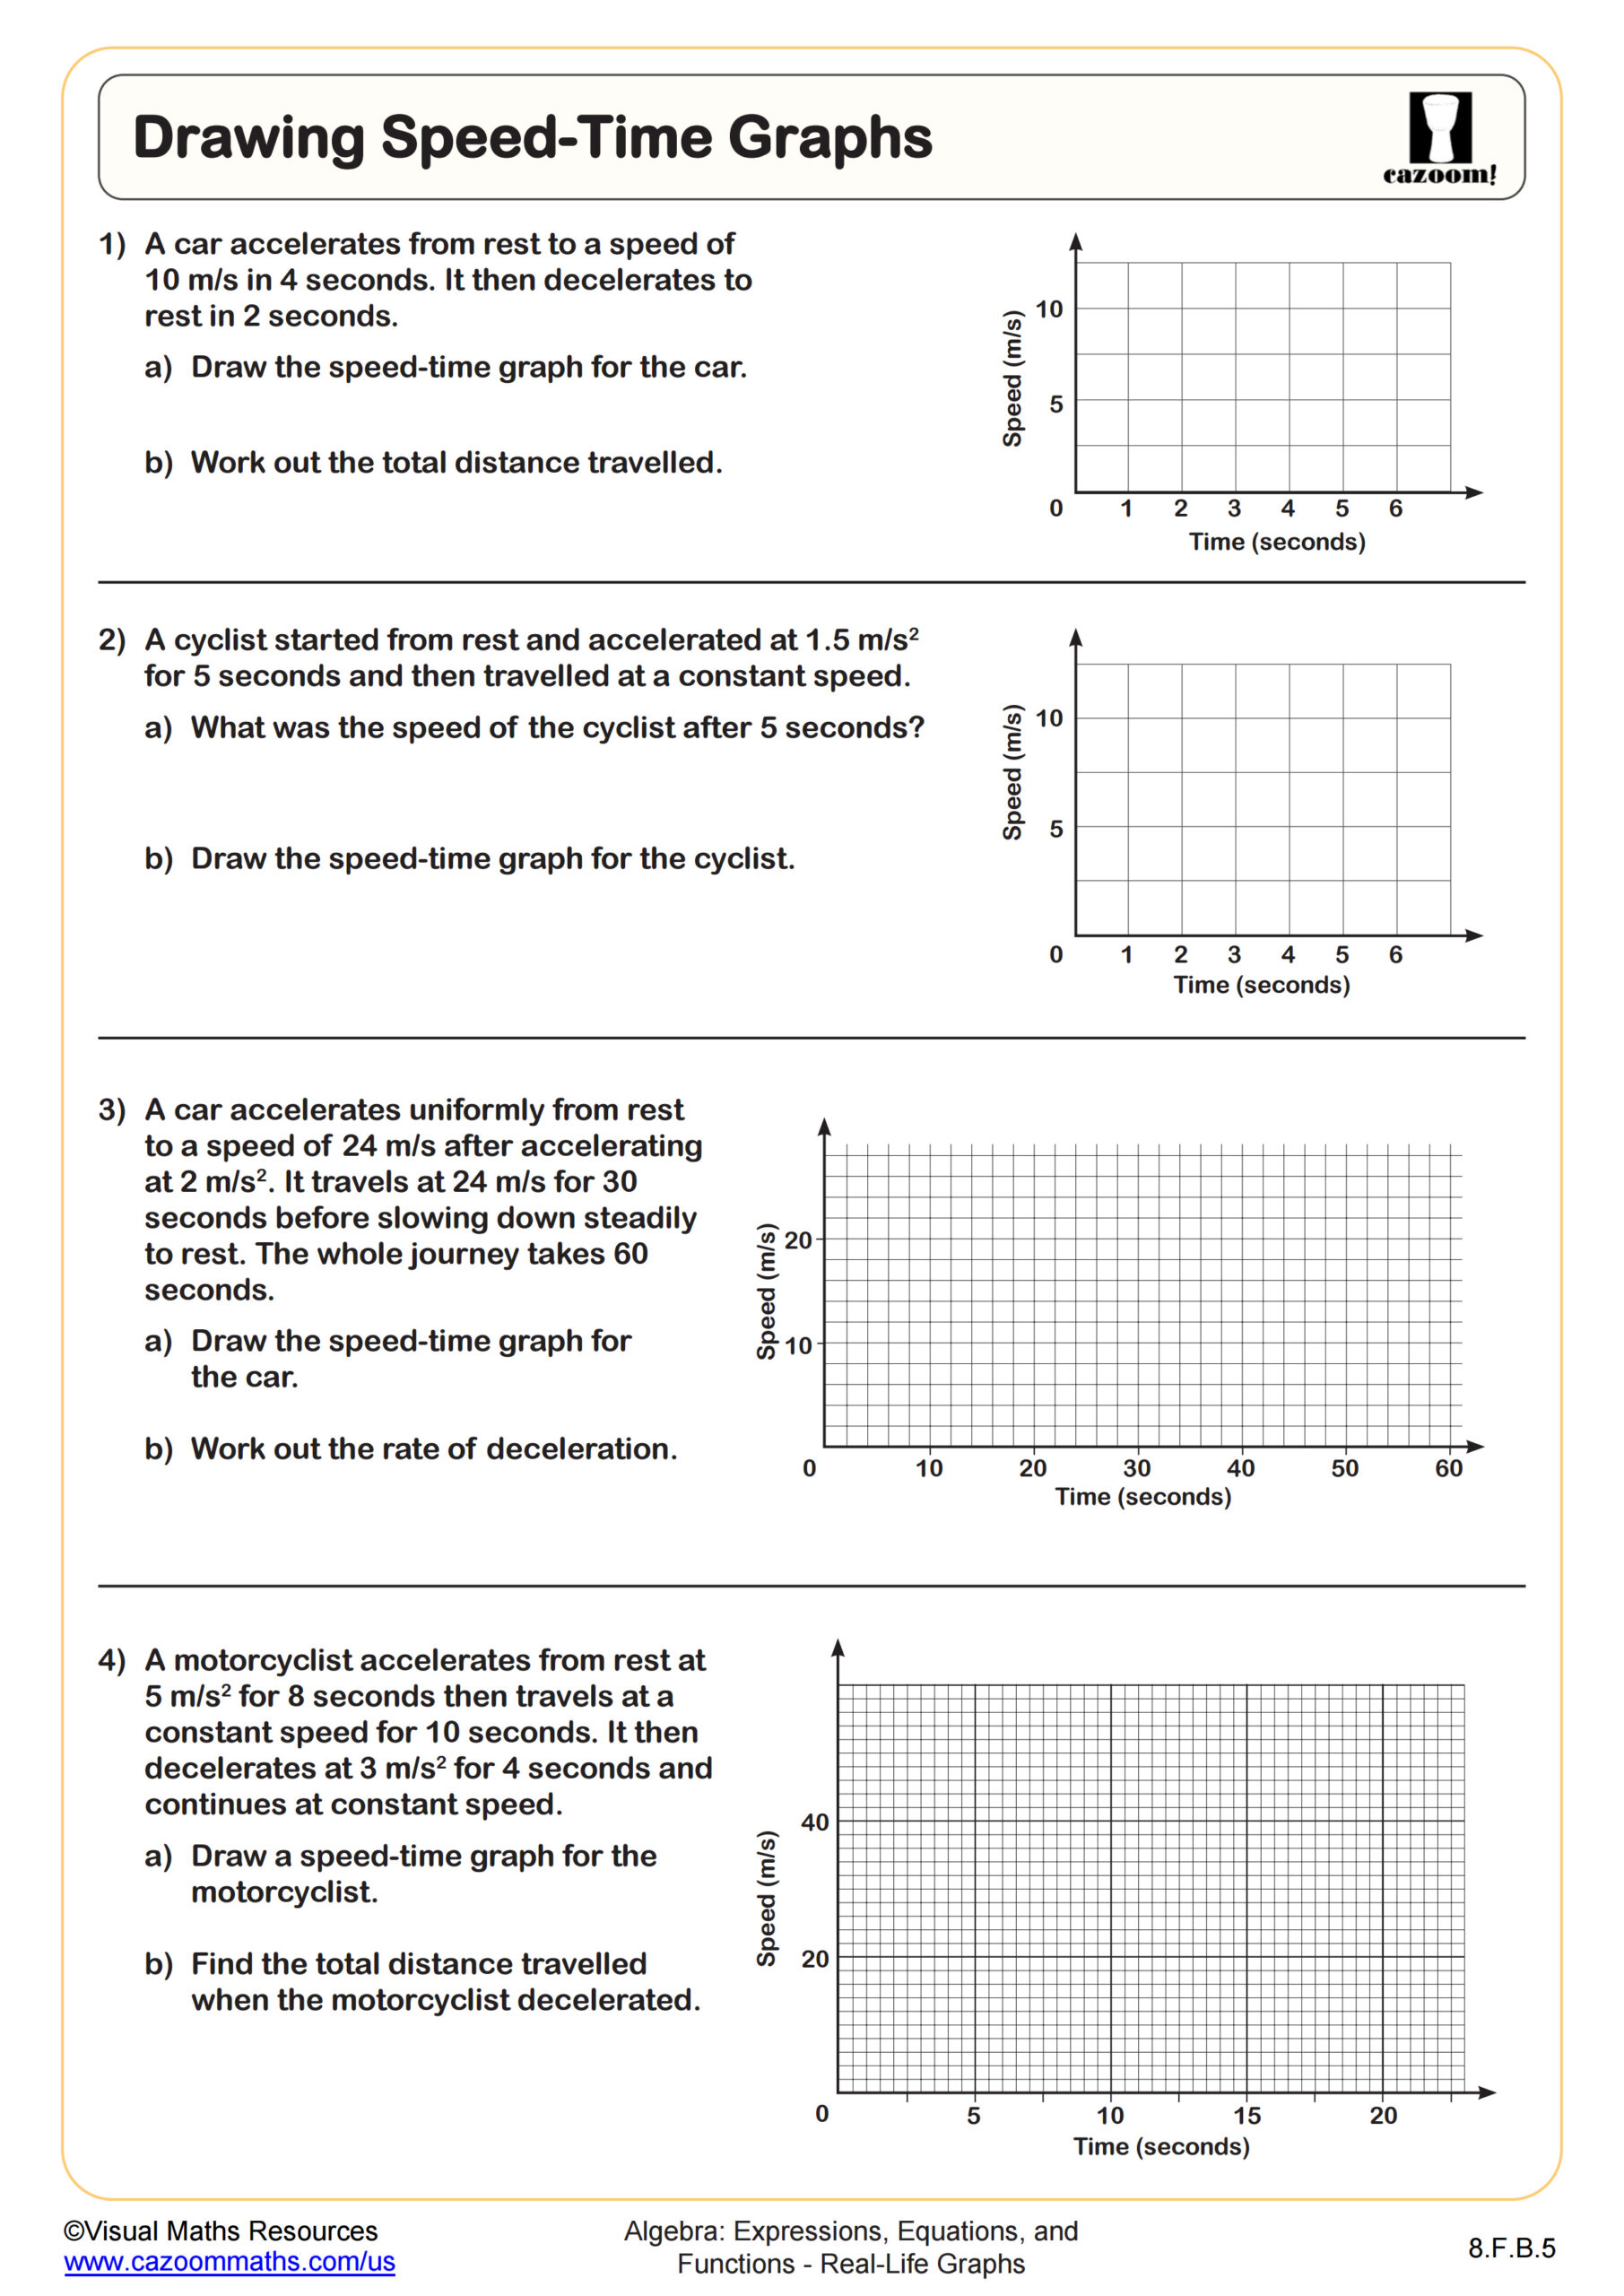
Drawing Speed-Time Graphs
Grades: 8th Grade
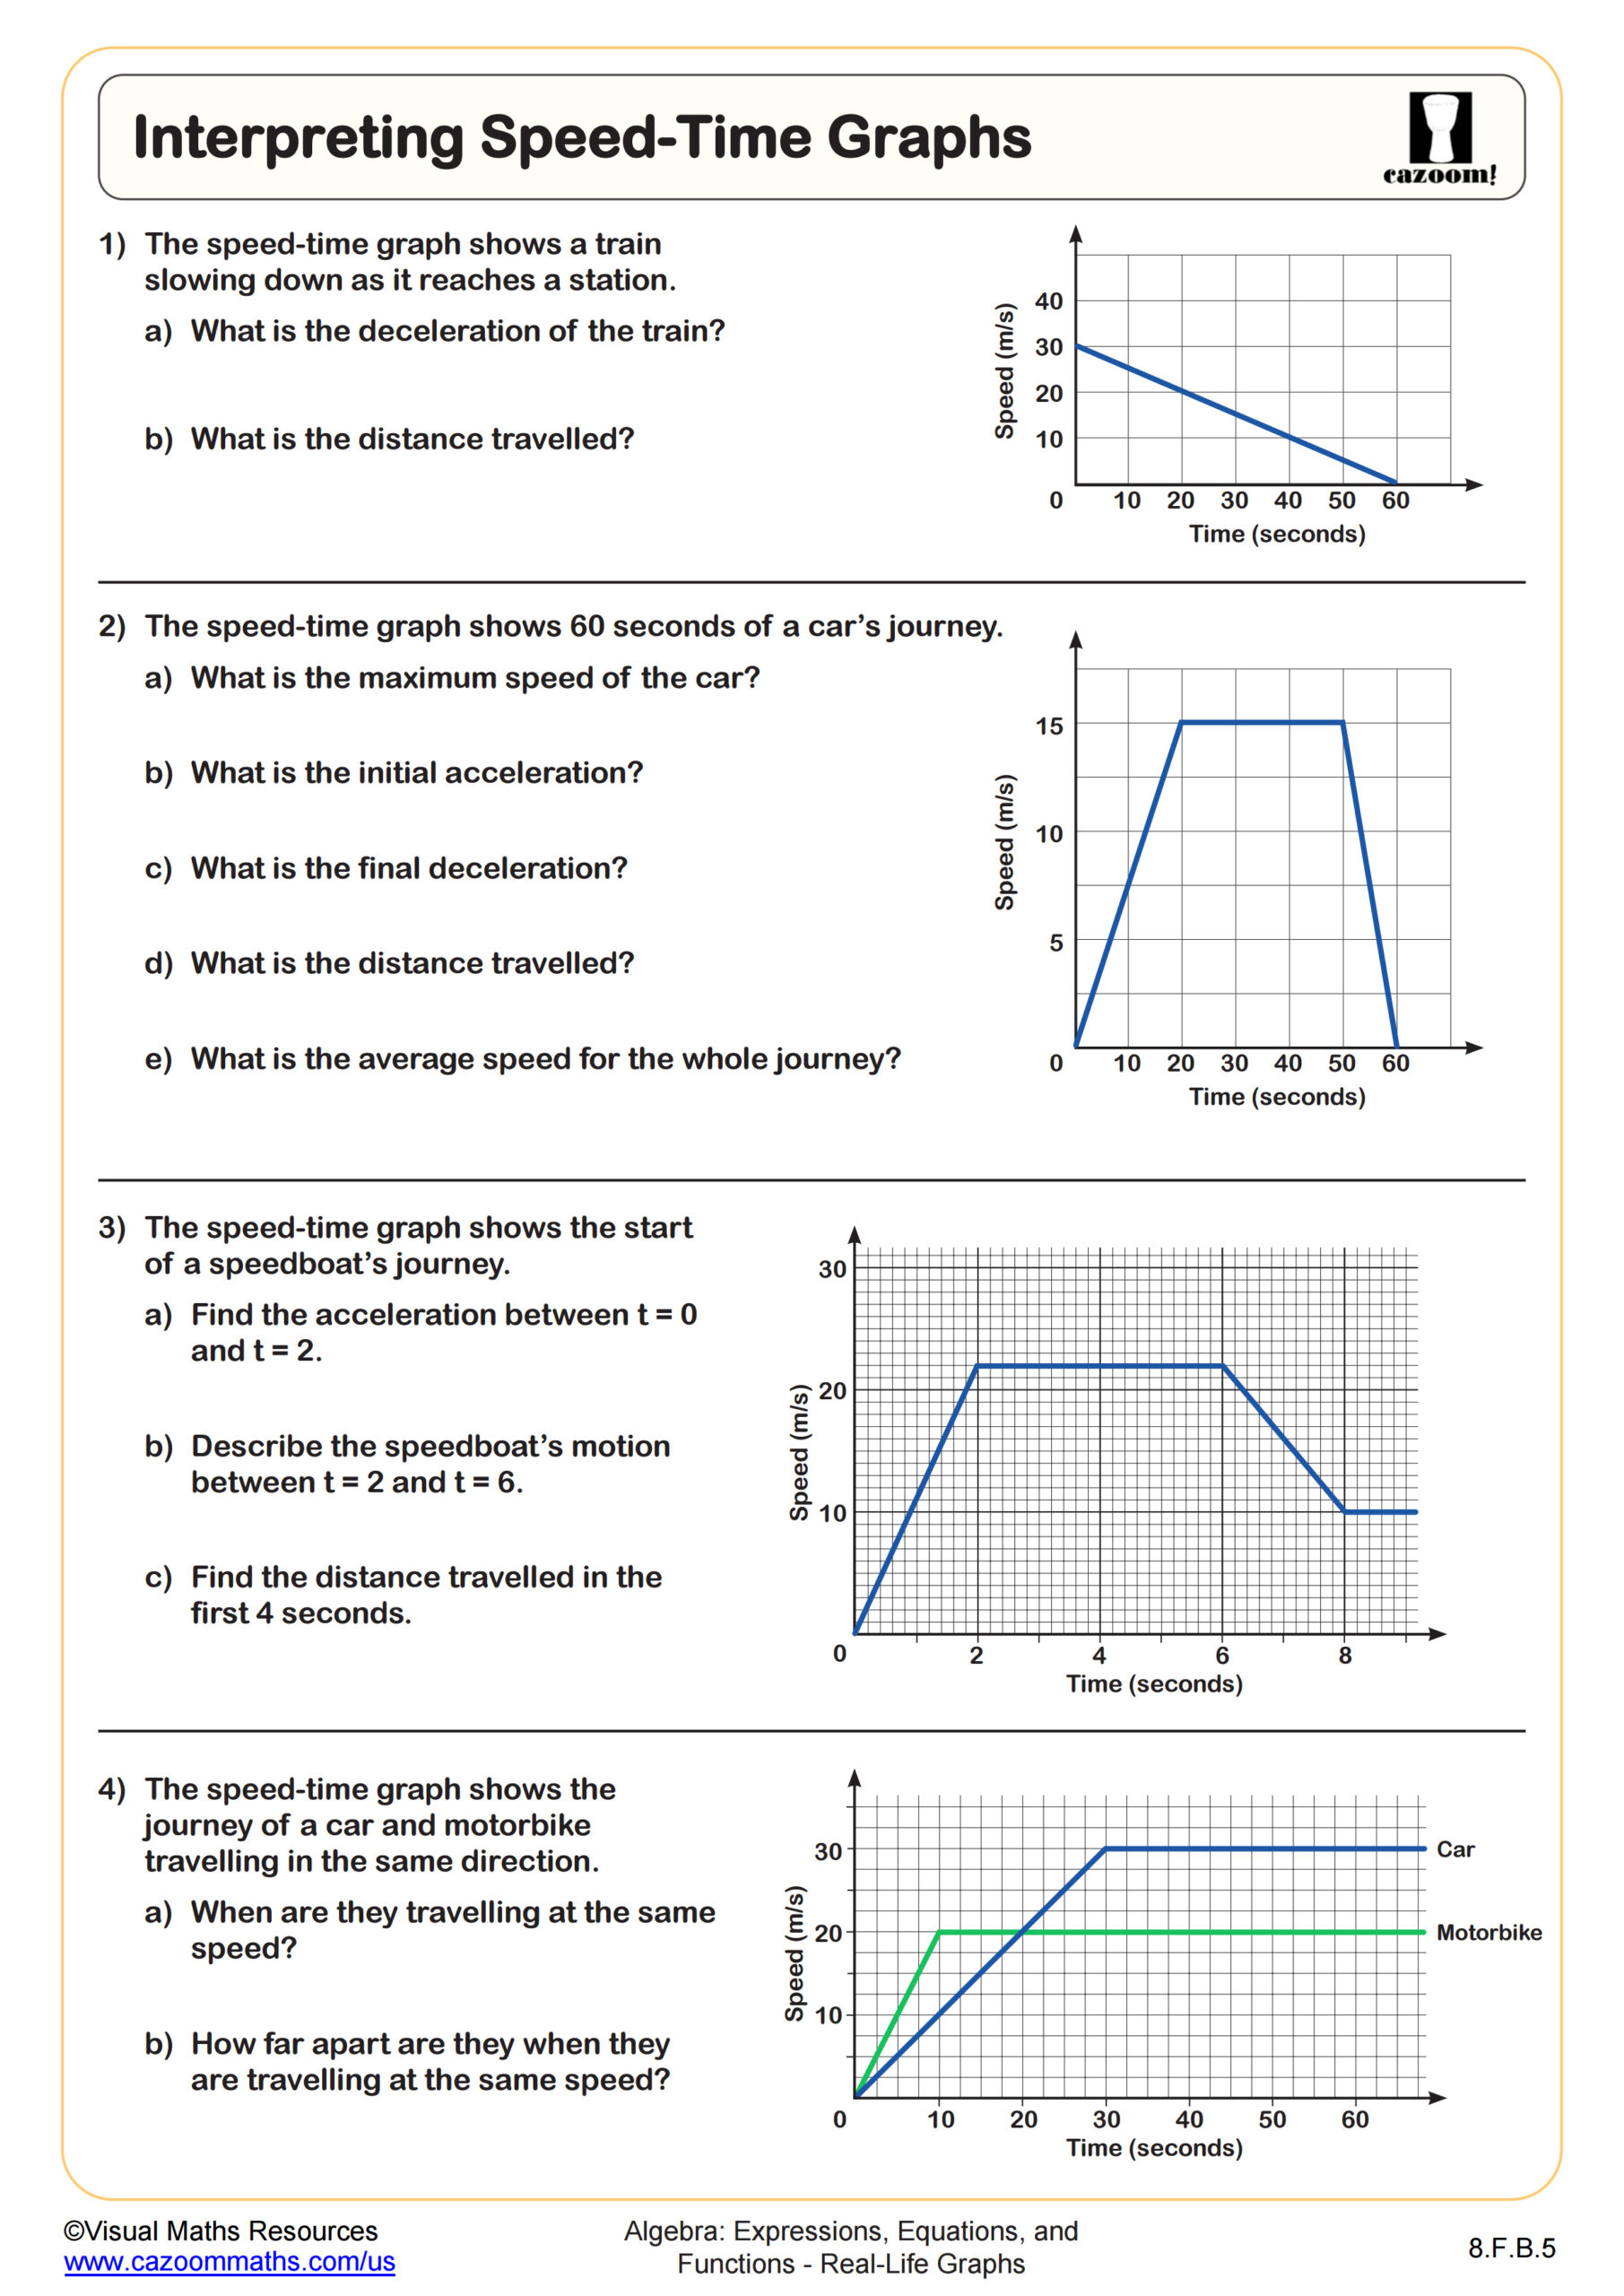
Interpreting Speed-Time Graphs
Grades: 8th Grade
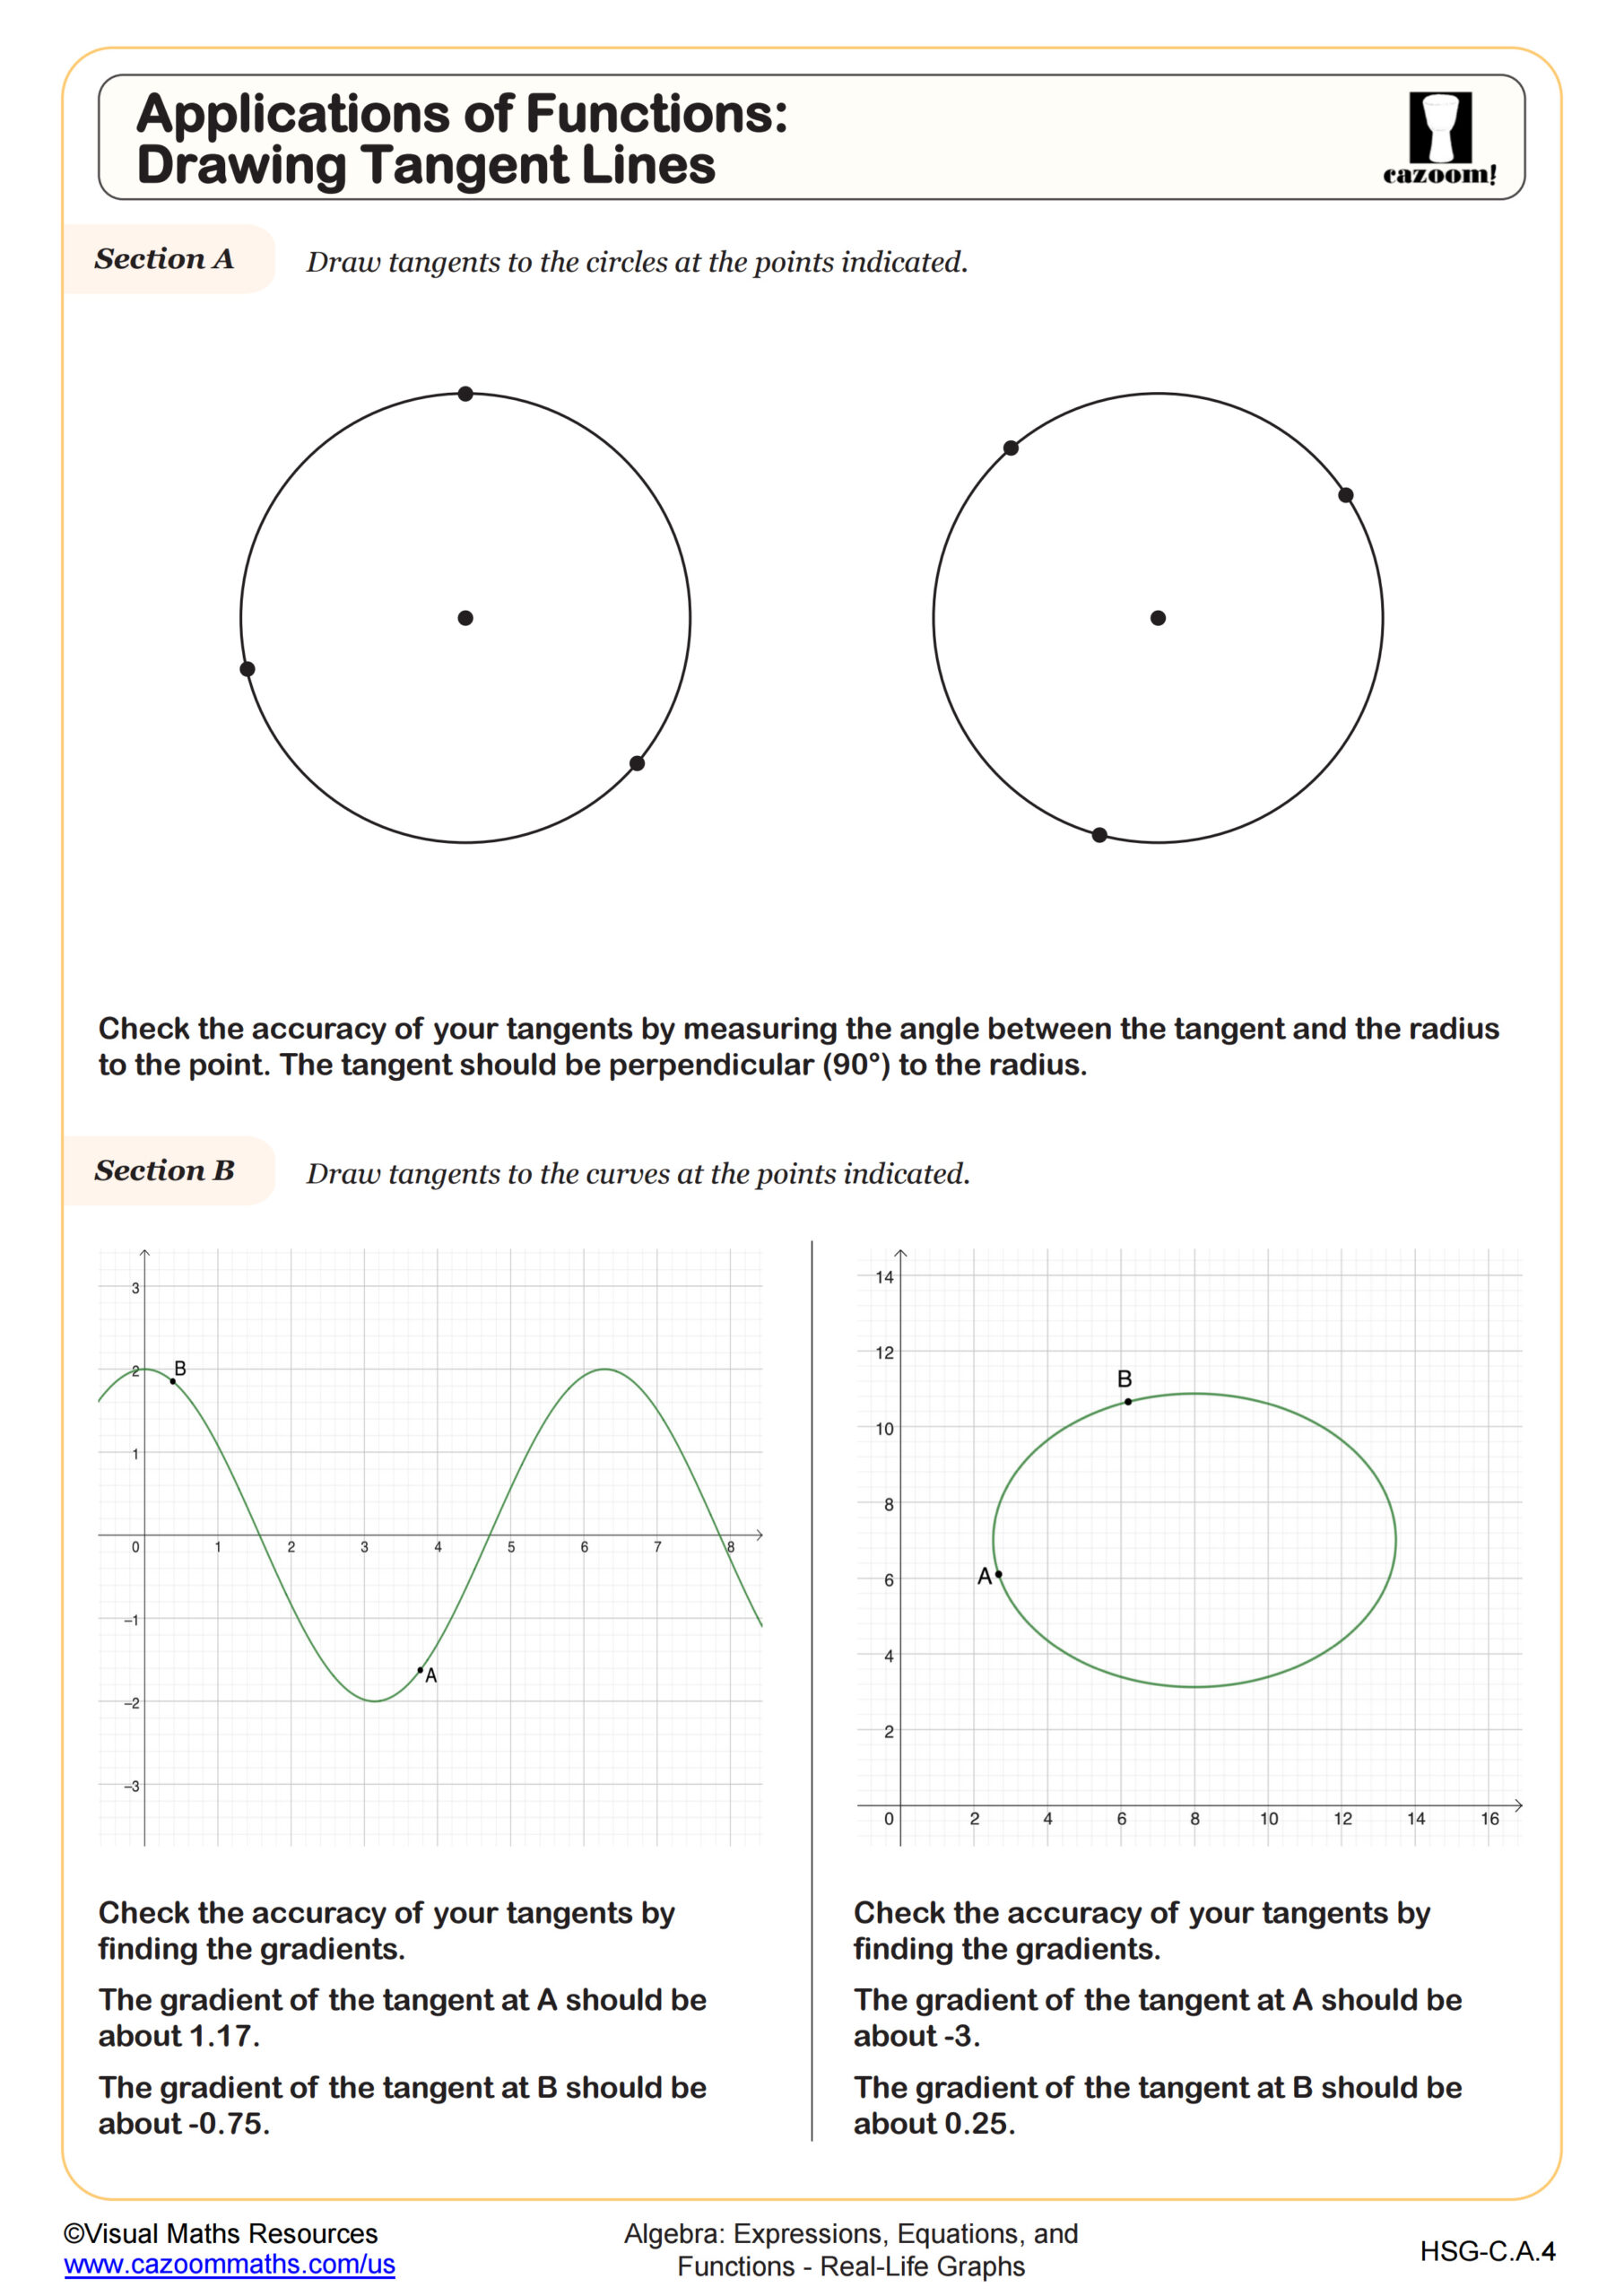
Applications of Functions: Drawing Tangent Lines
Grades: Algebra I, IM 1
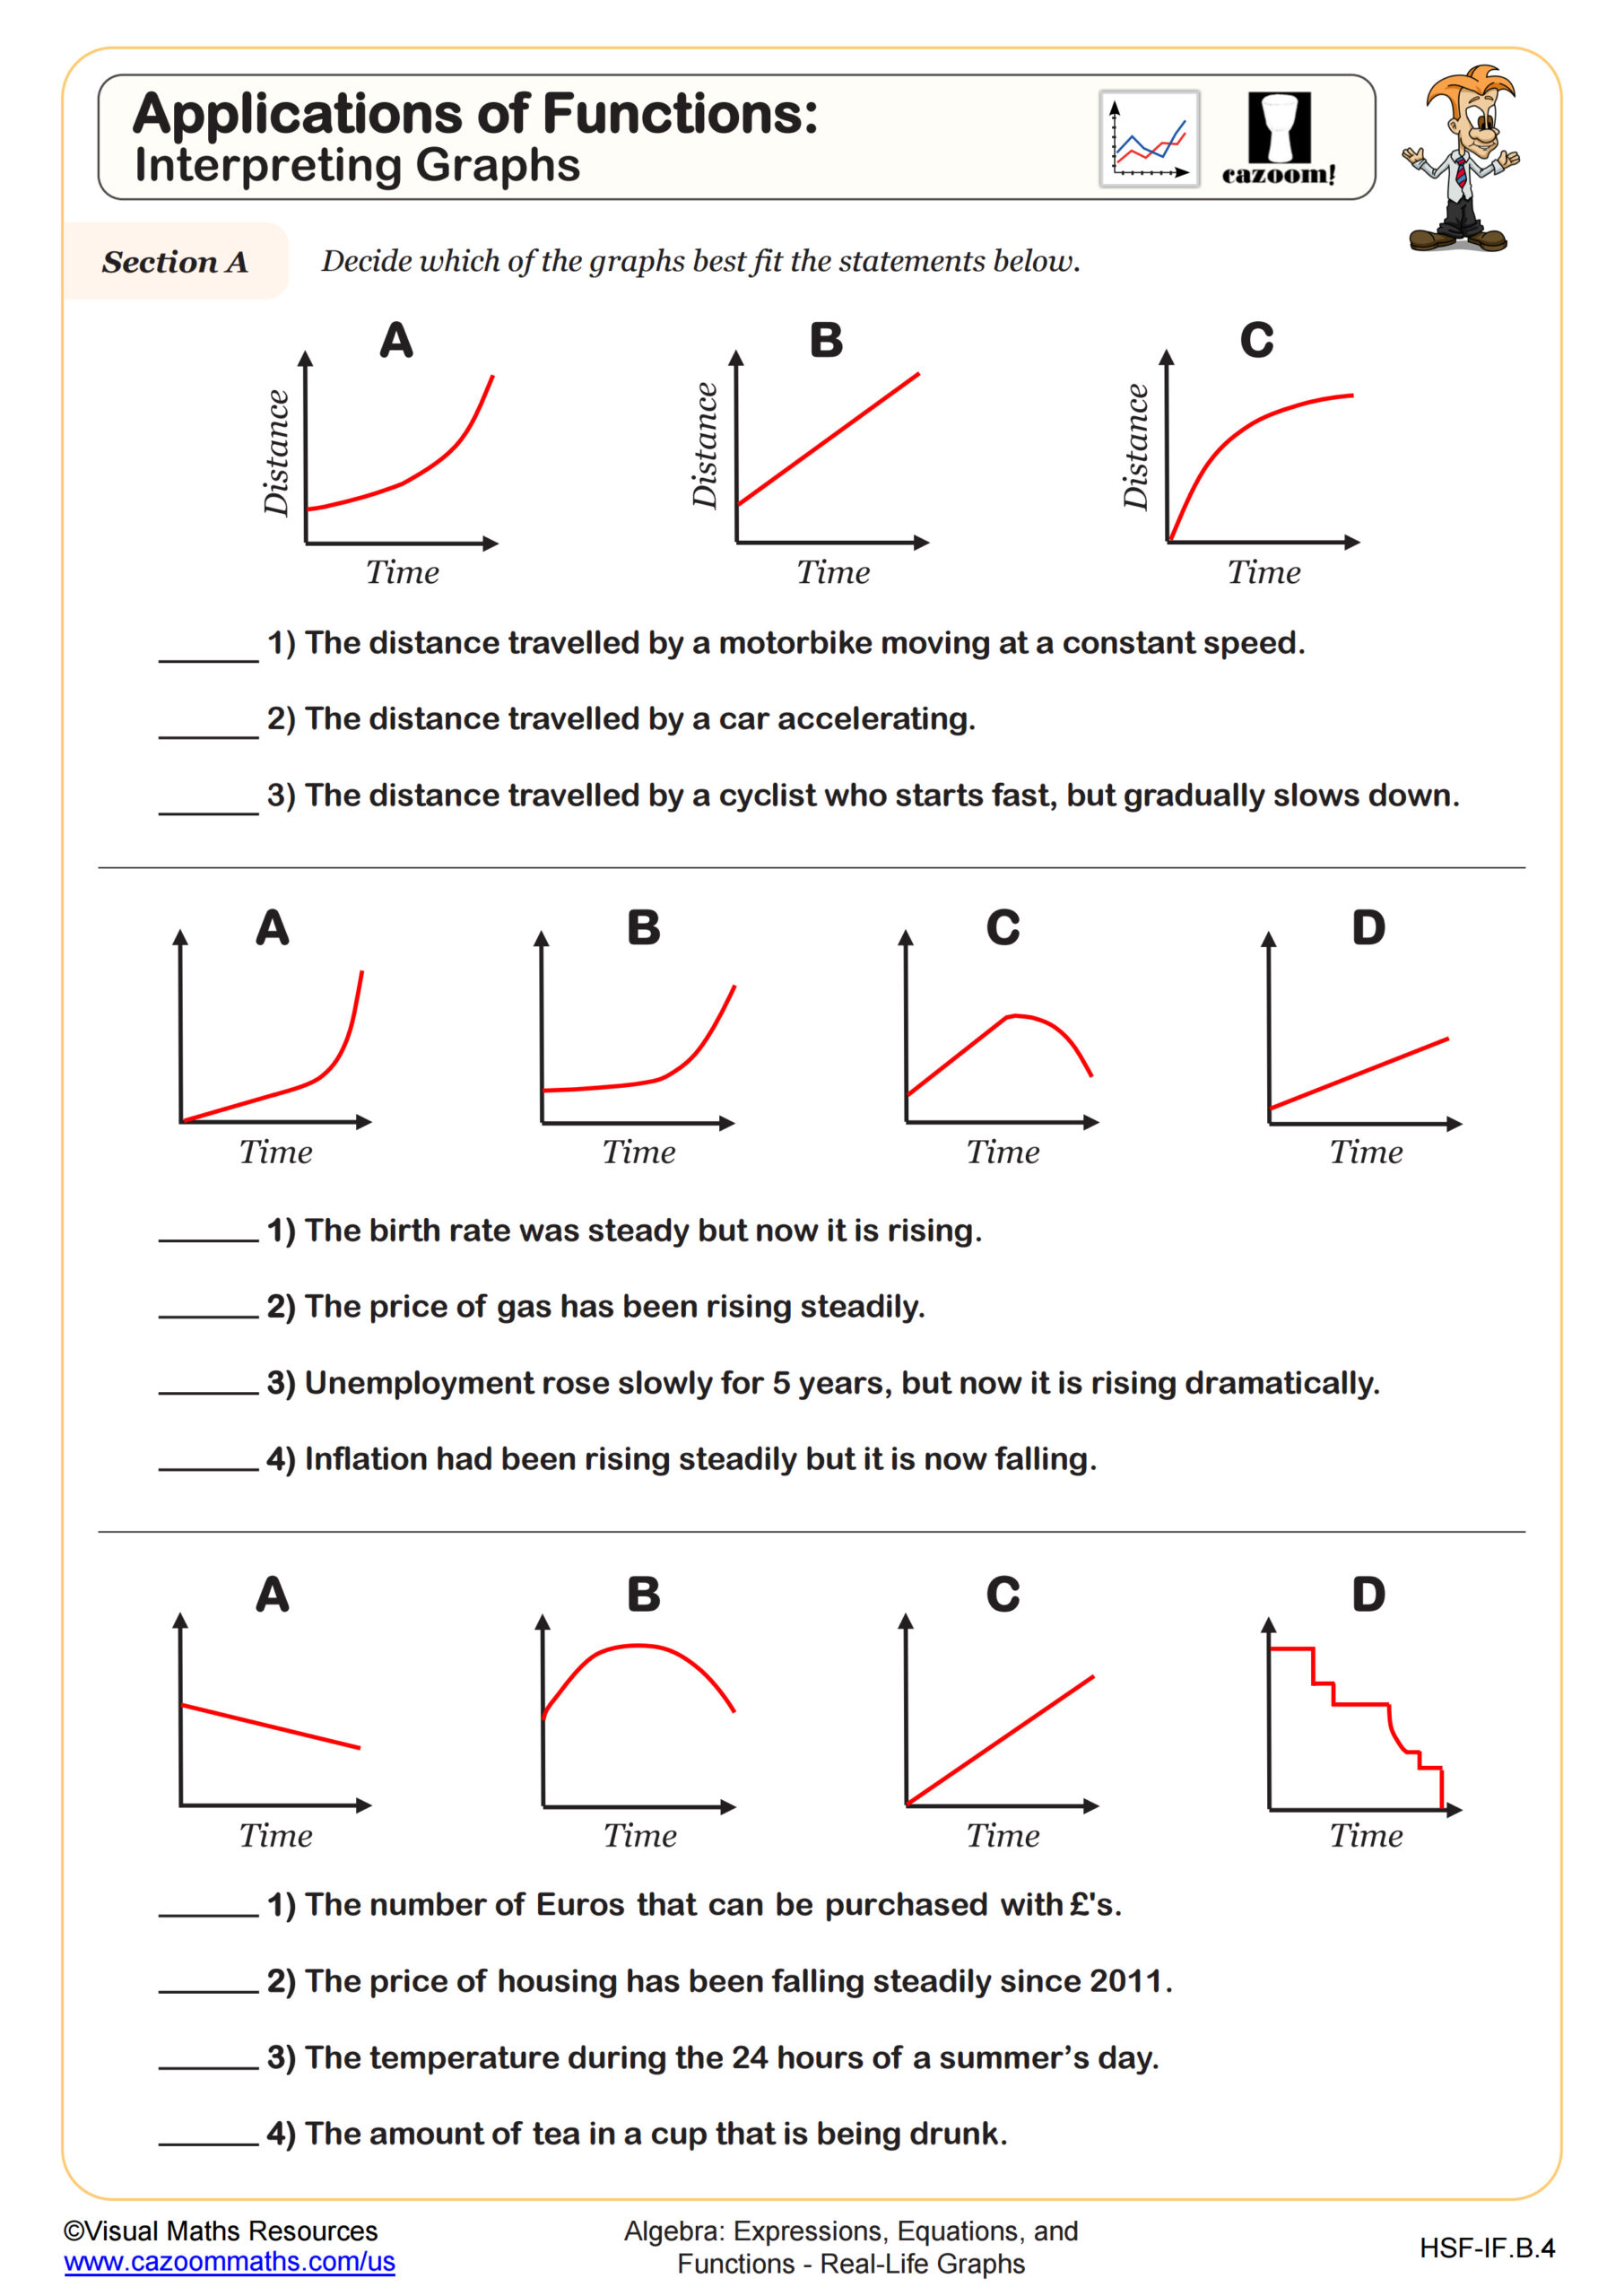
Applications of Functions: Interpreting Graphs
Grades: Algebra I, IM 1
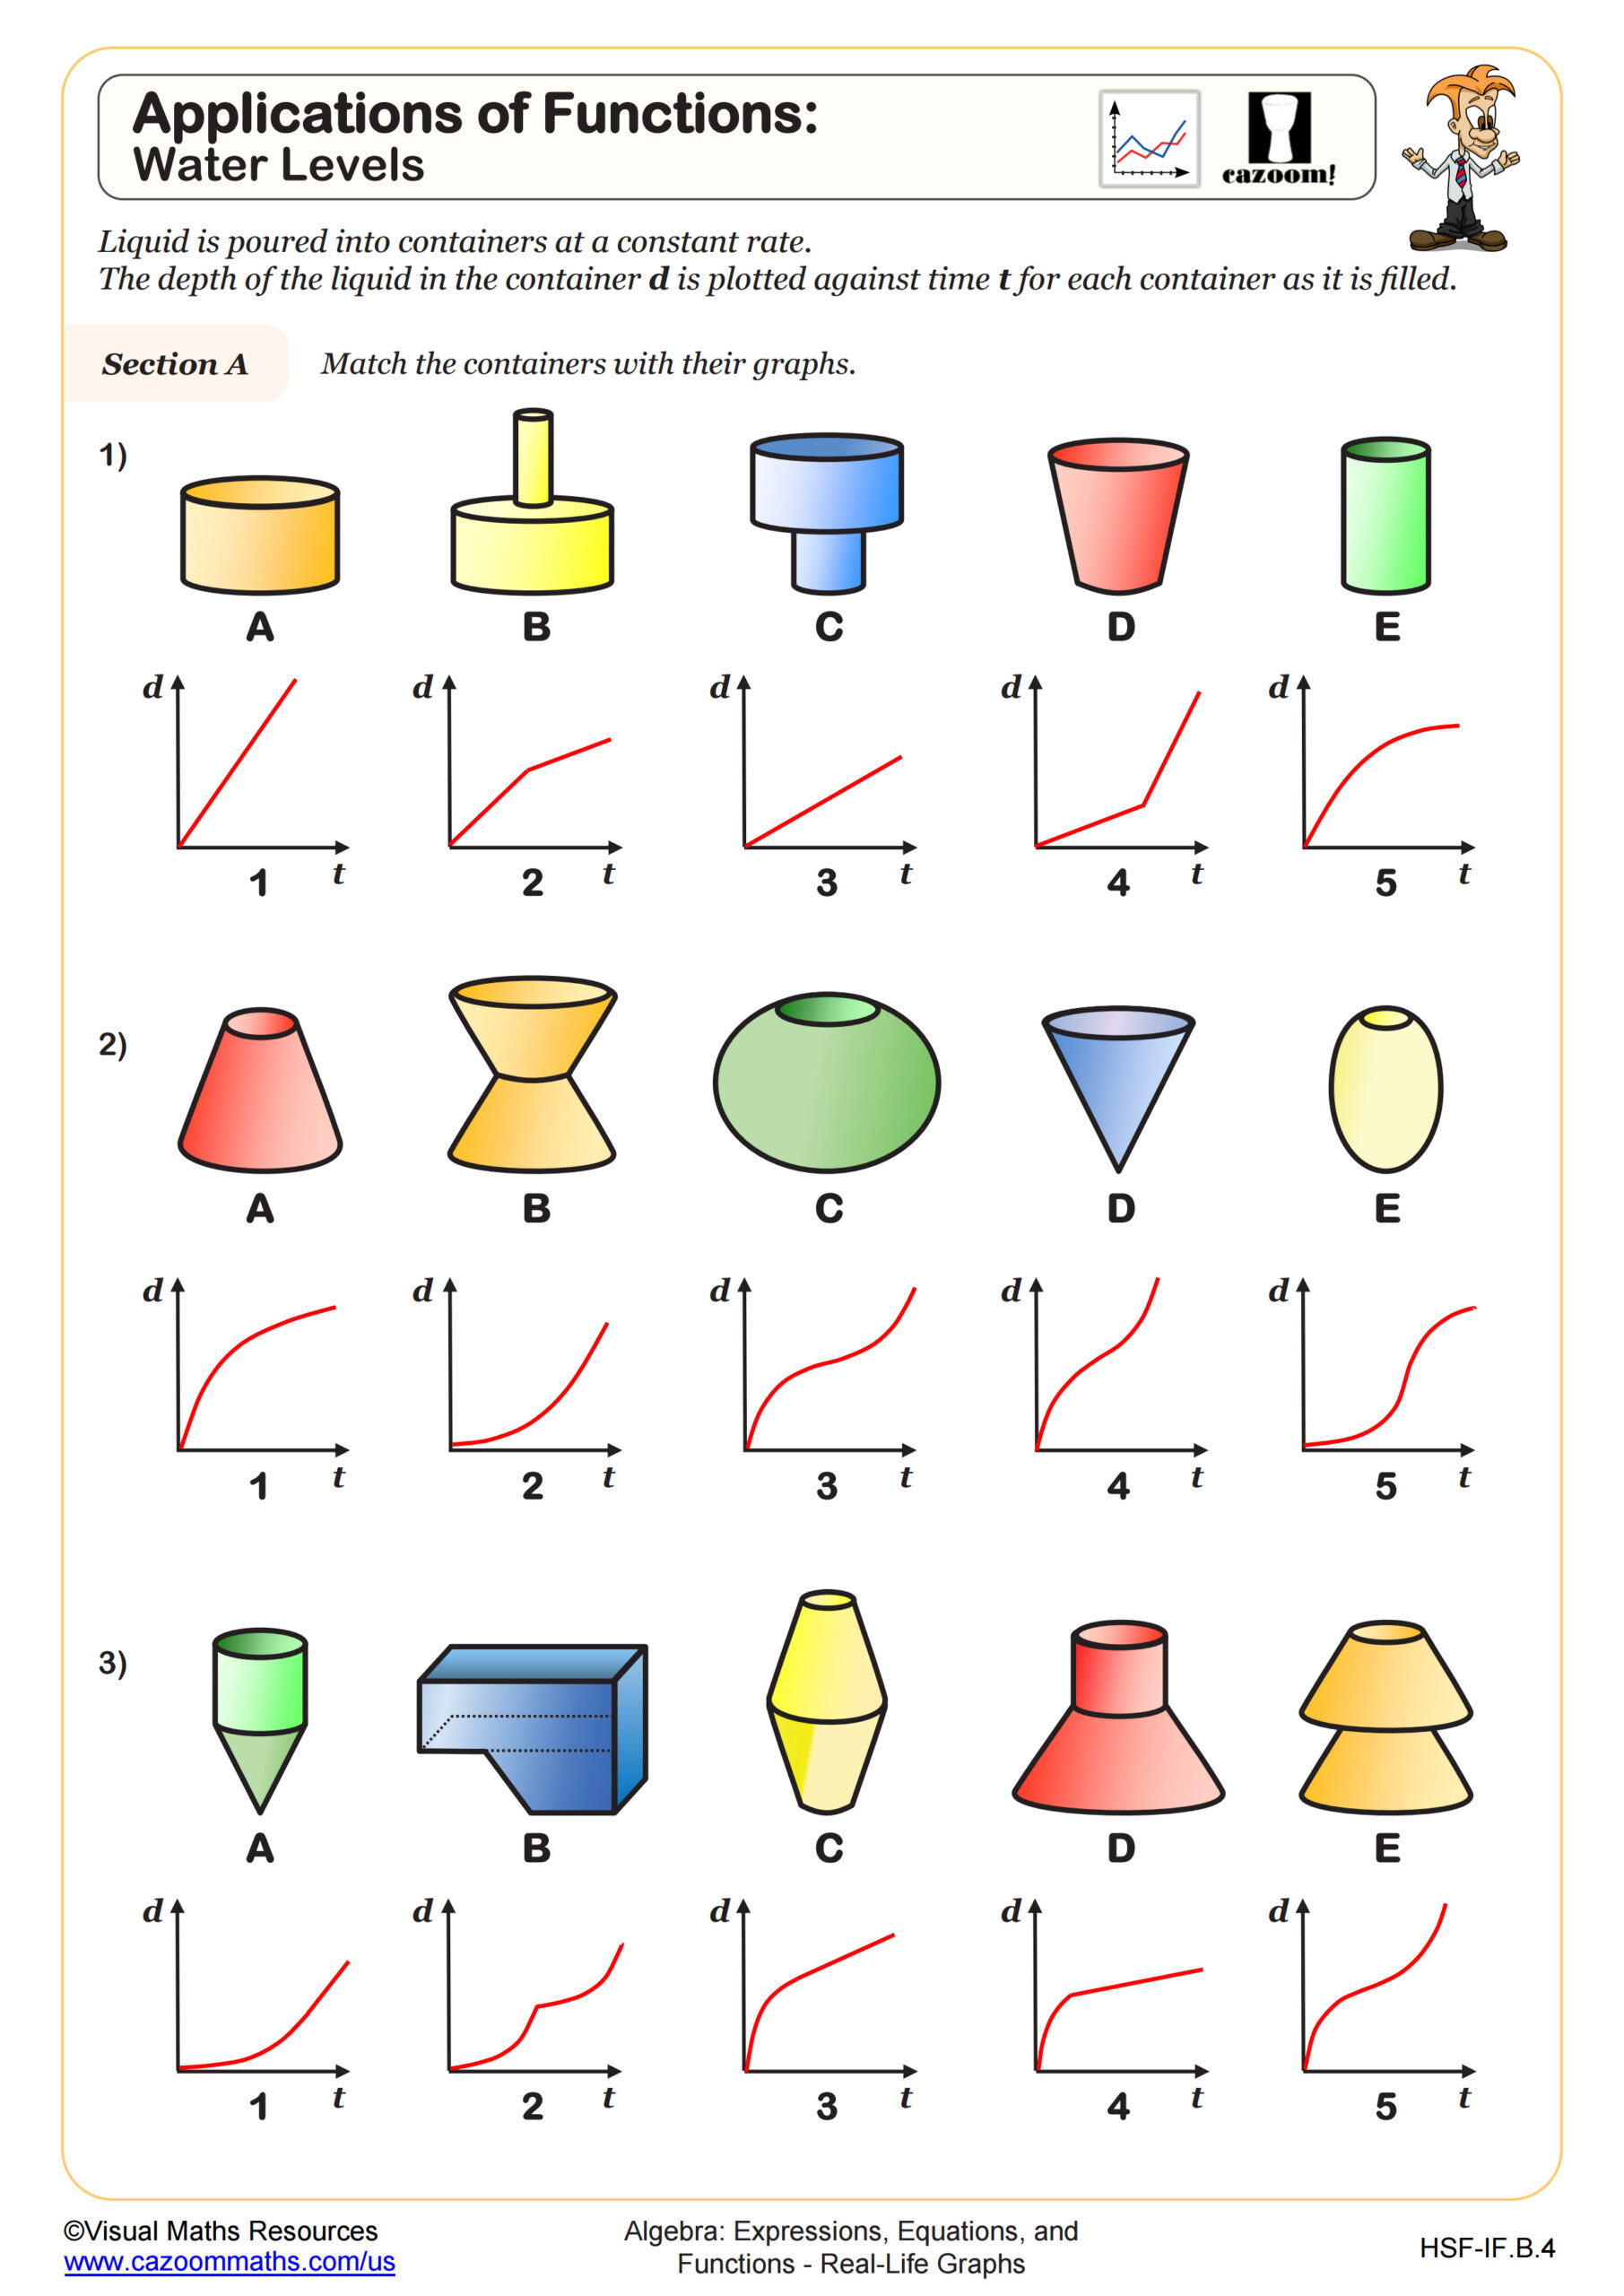
Applications of Functions: Water Levels
Grades: Algebra I, IM 1
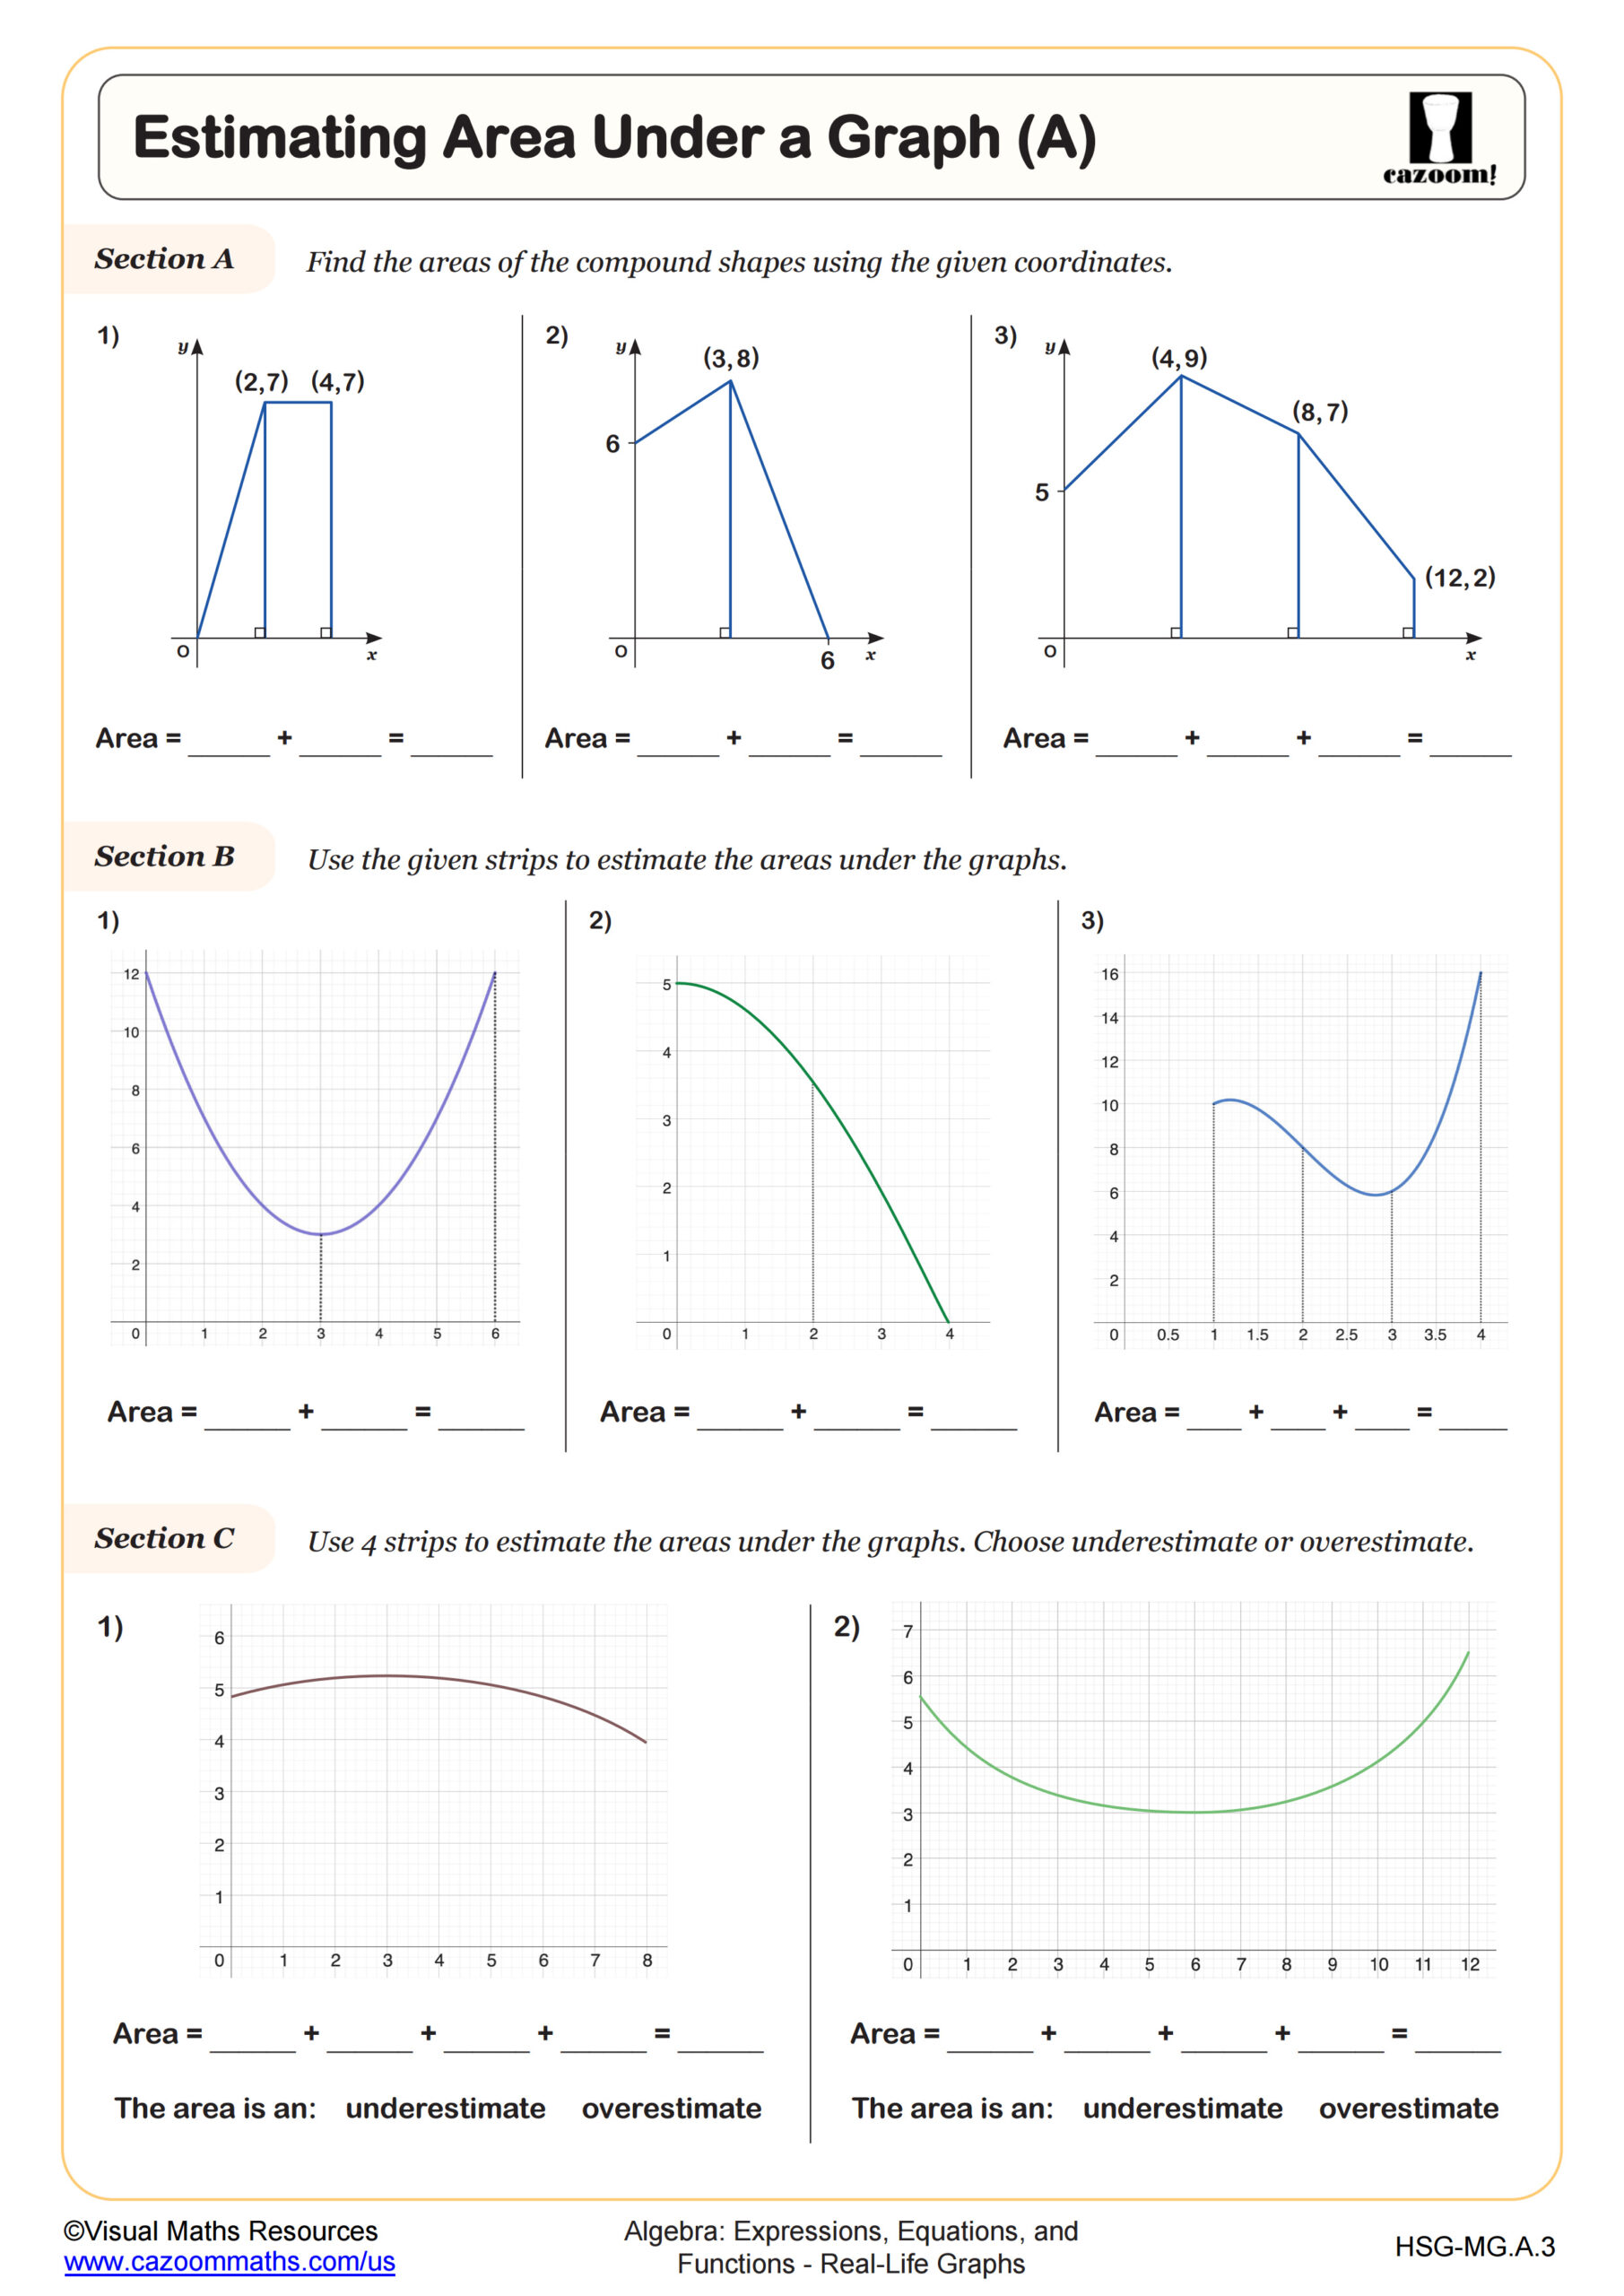
Estimating Area Under a Graph (A)
Grades: Algebra I, IM 1
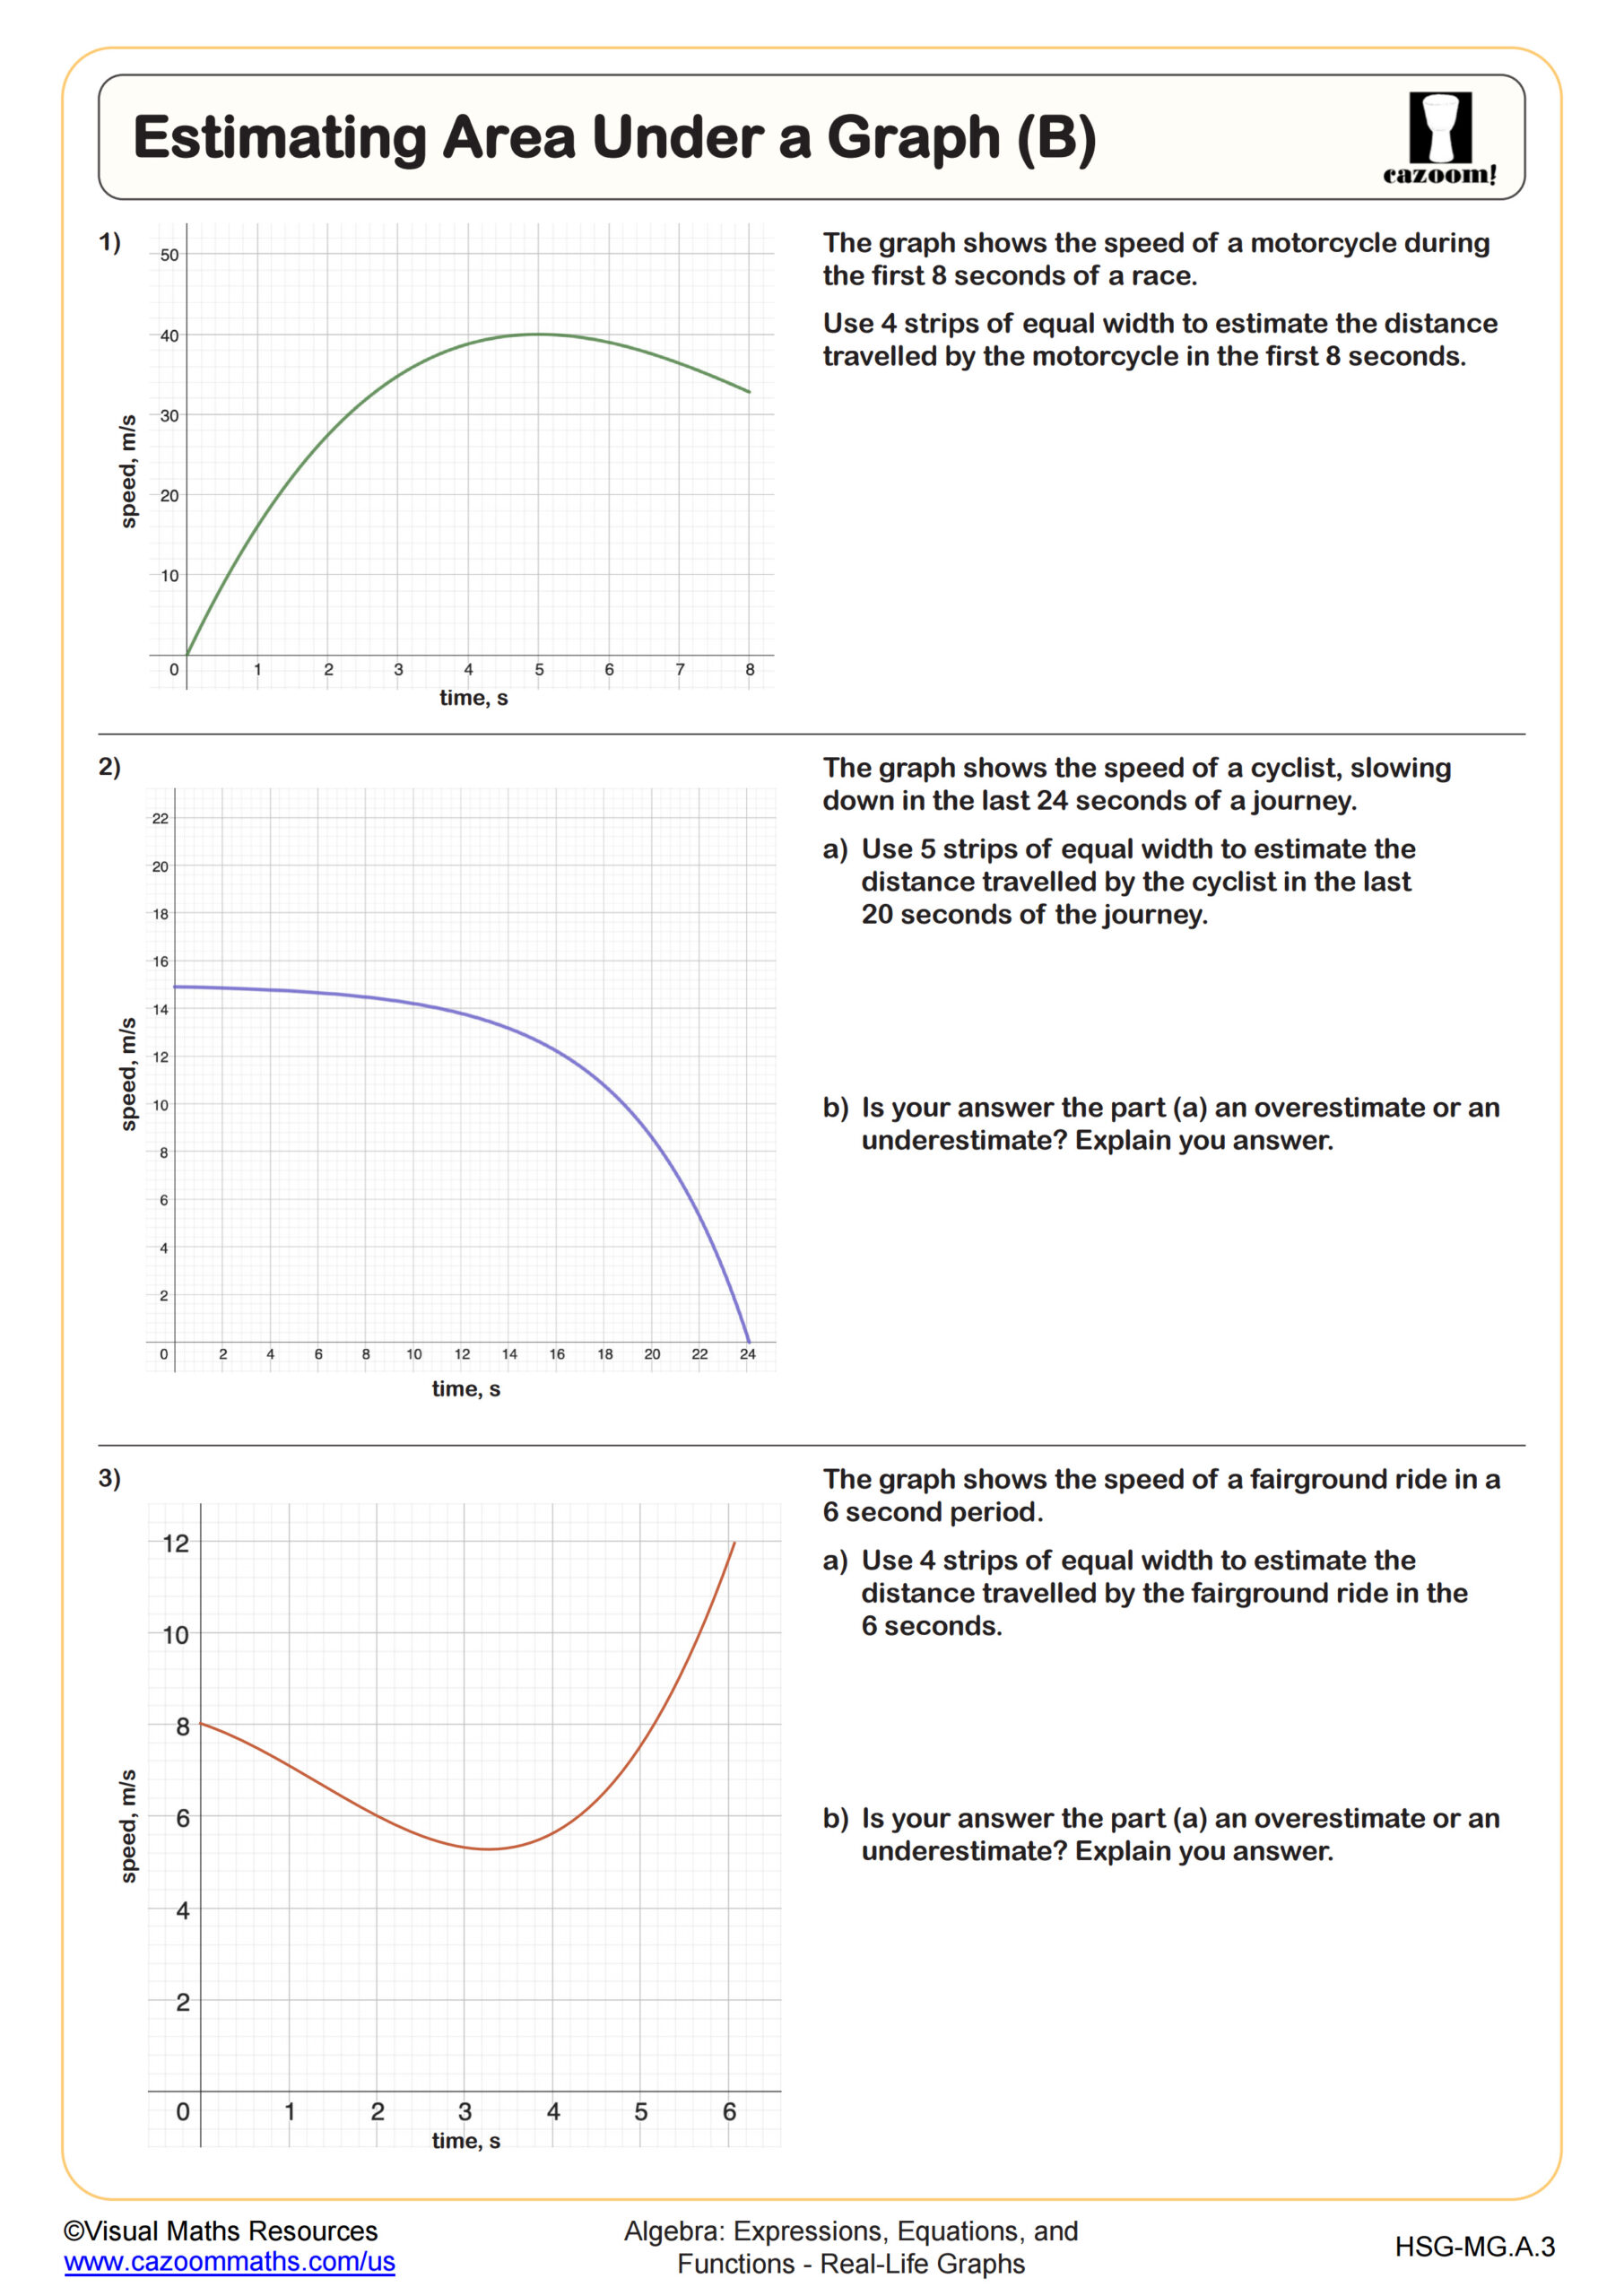
Estimating Area Under a Graph (B)
Grades: Algebra I, IM 1
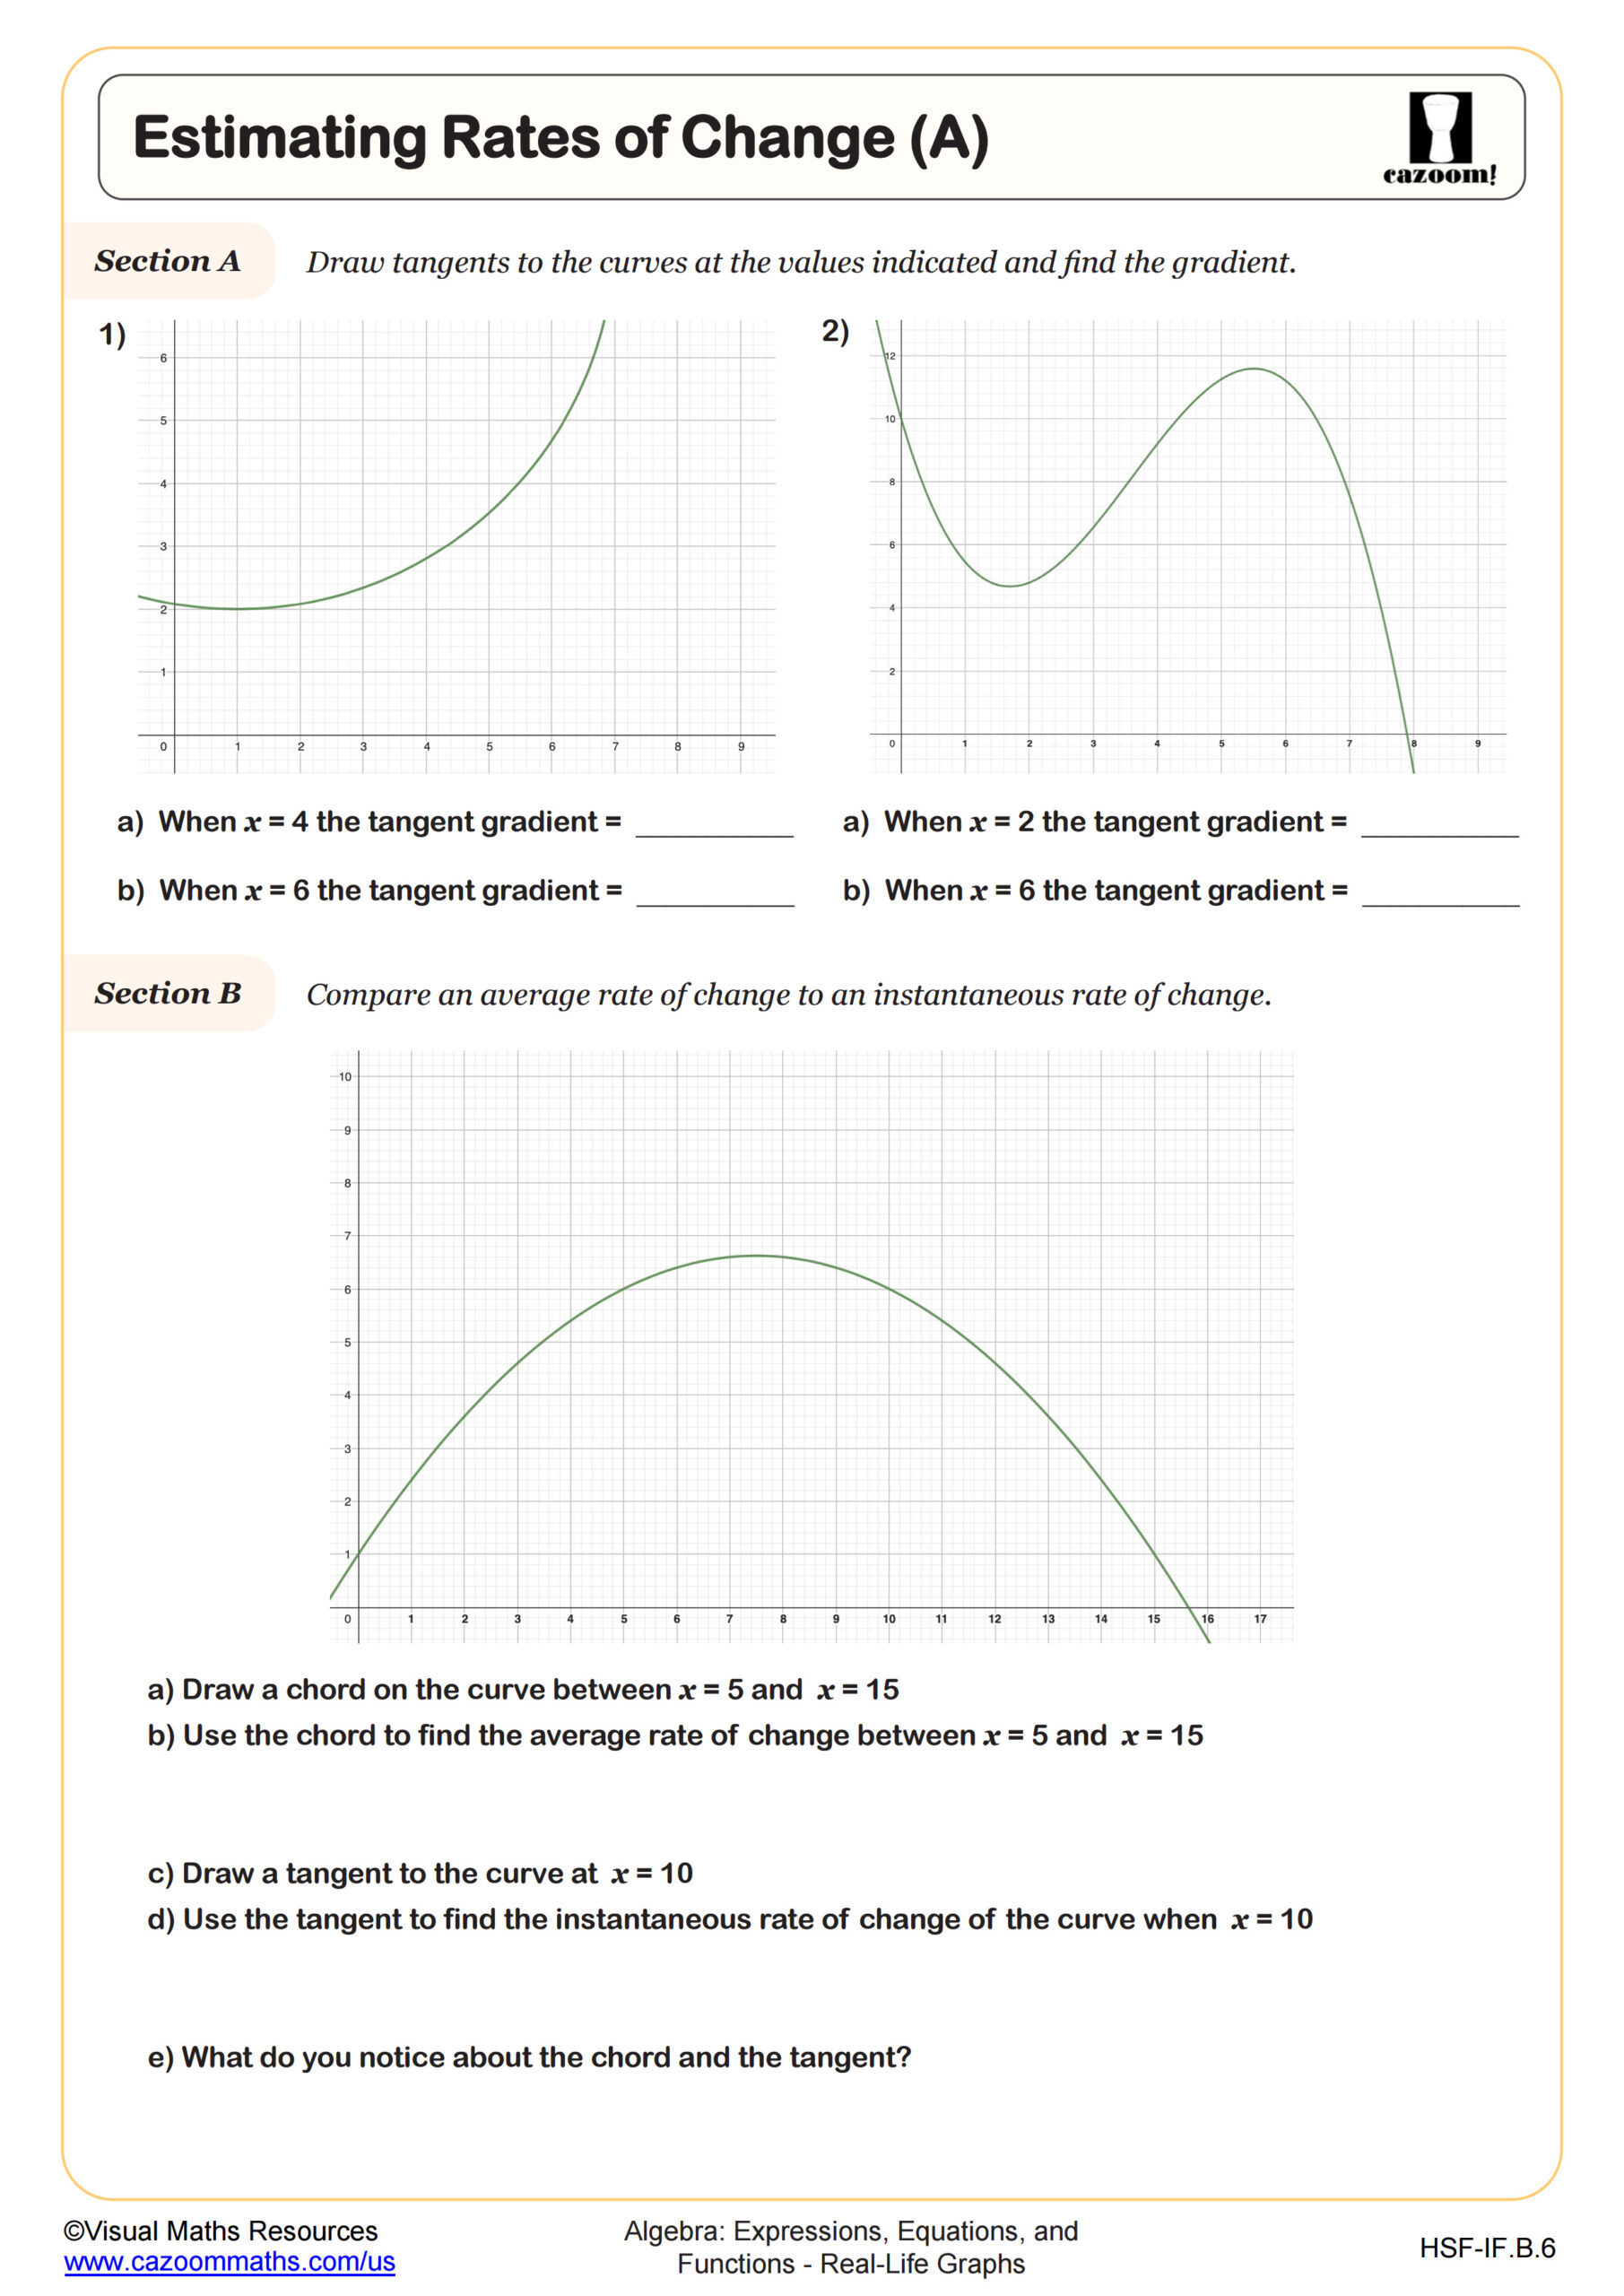
Estimating Rates of Change (A)
Grades: Algebra I, IM 1
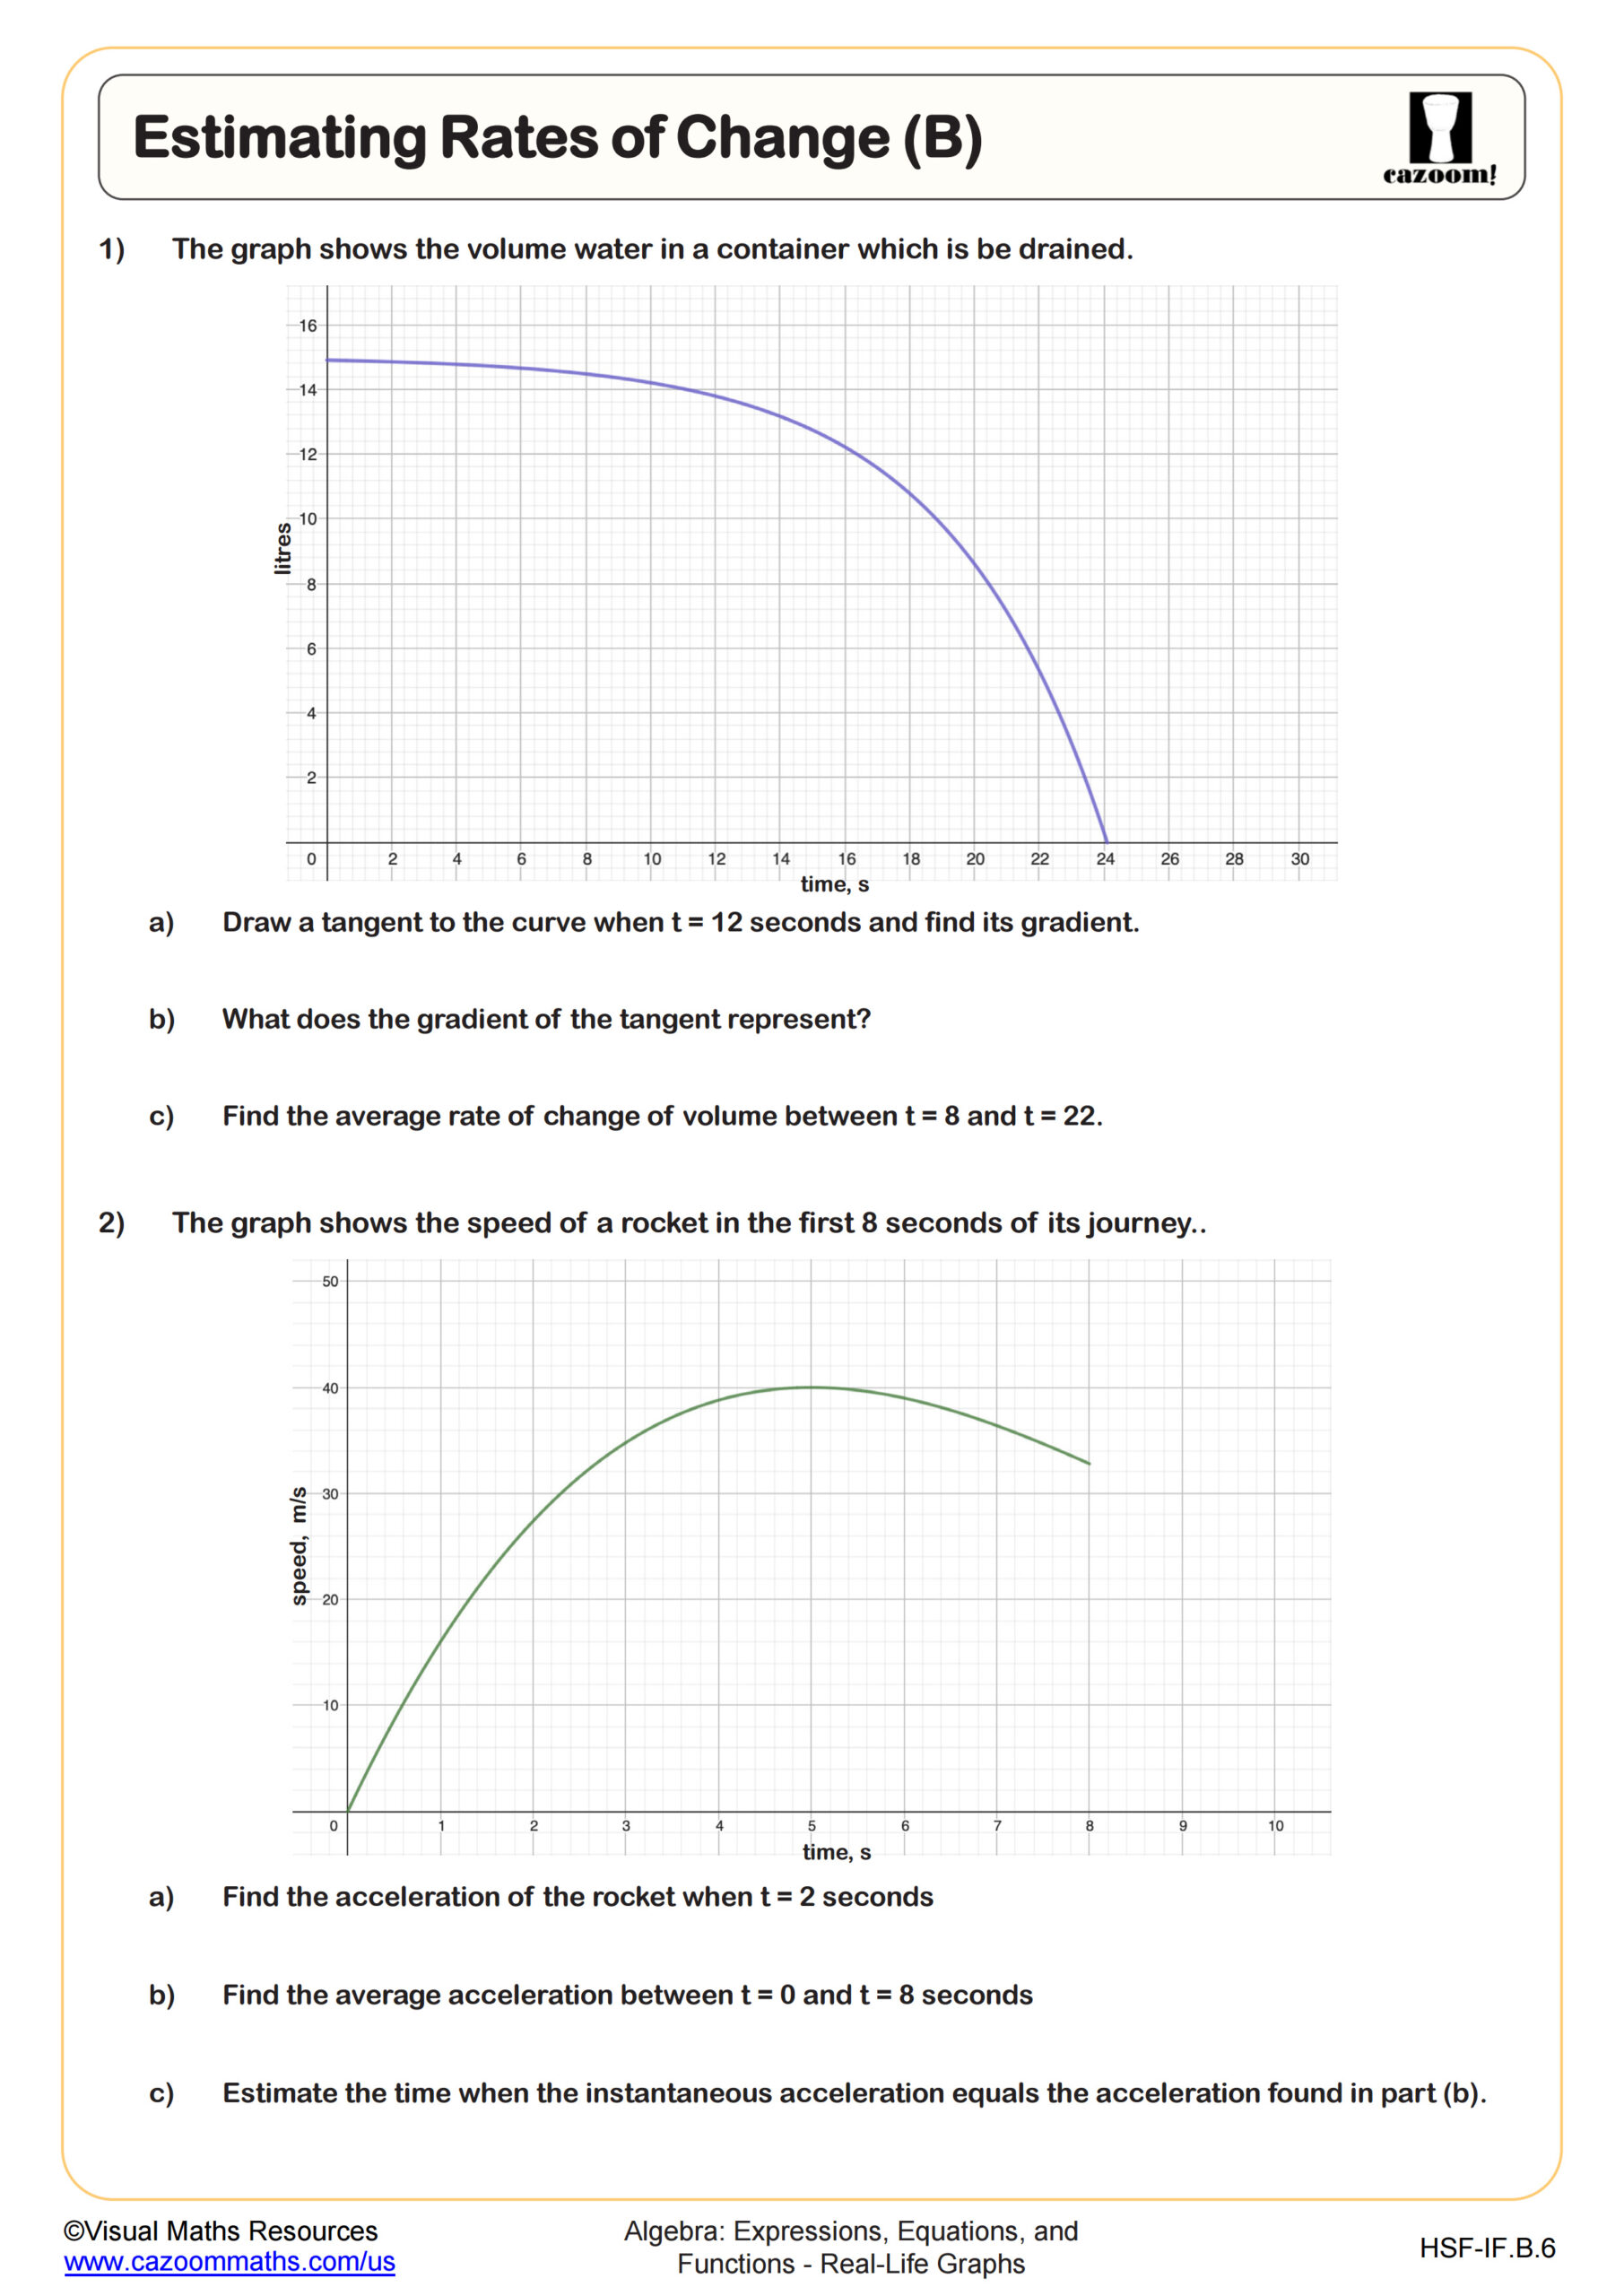
Estimating Rates of Change (B)
Grades: Algebra I, IM 1
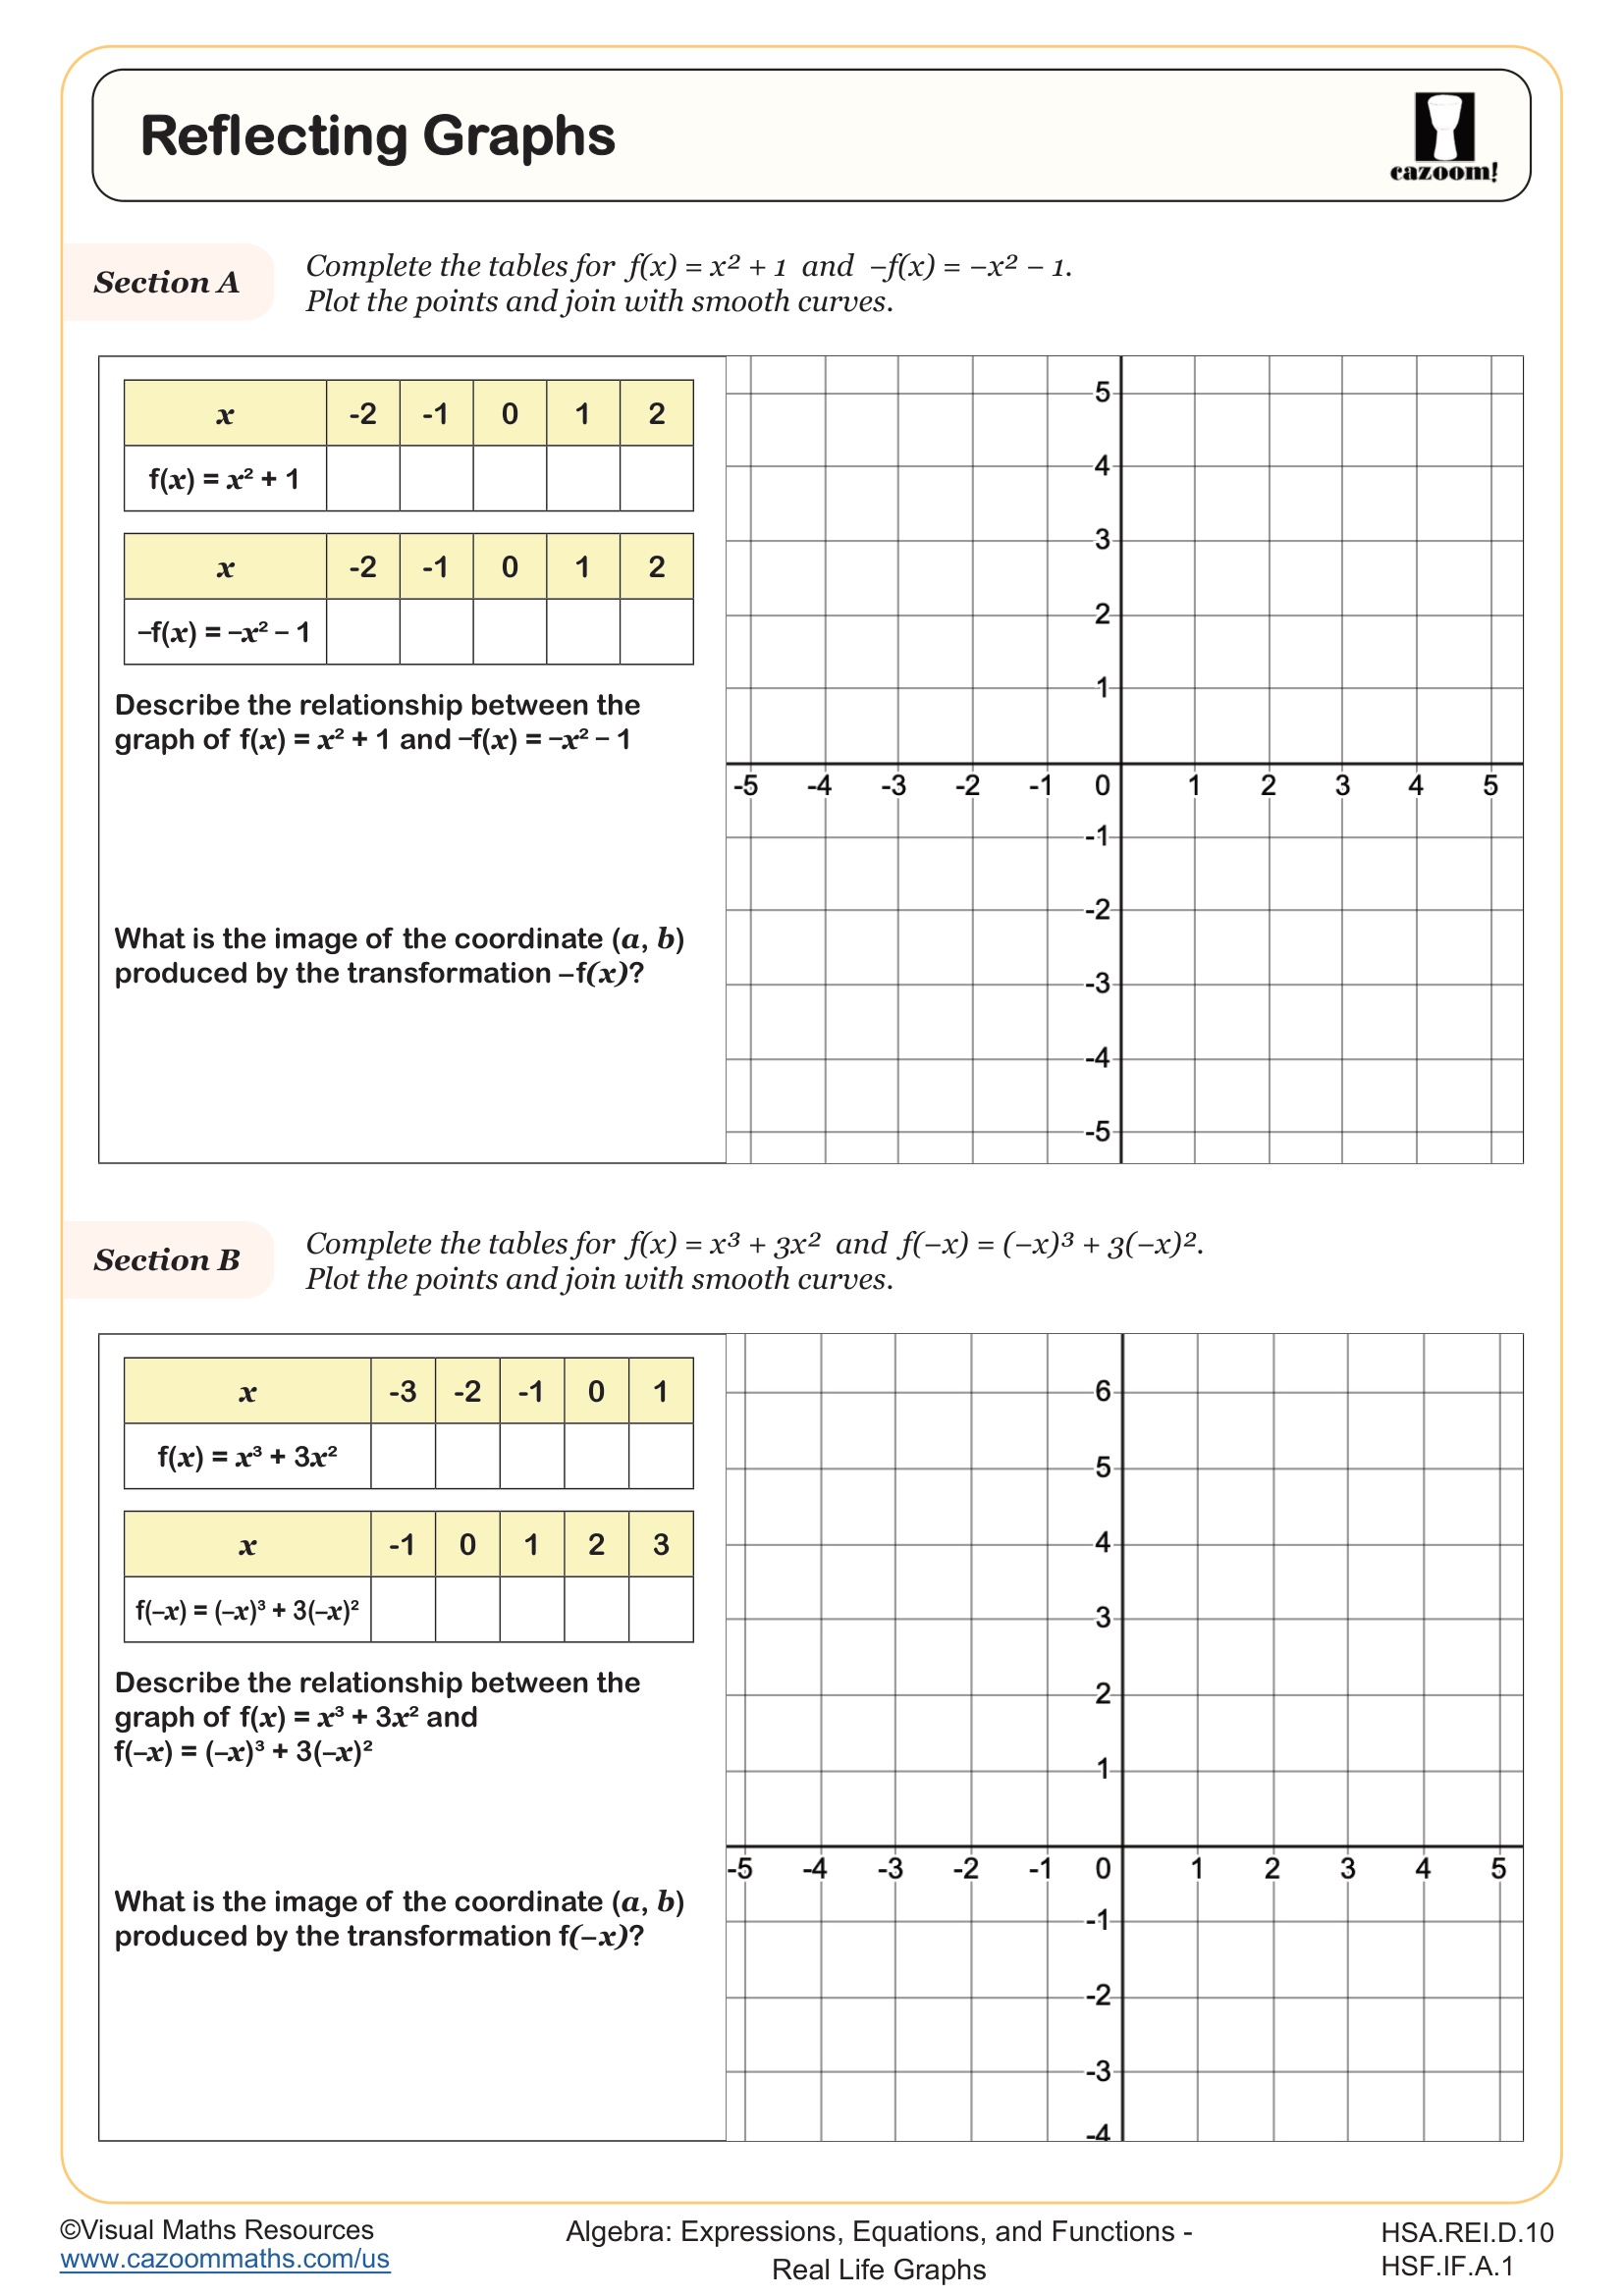
Reflecting Graphs
Grades: Algebra I, IM 1
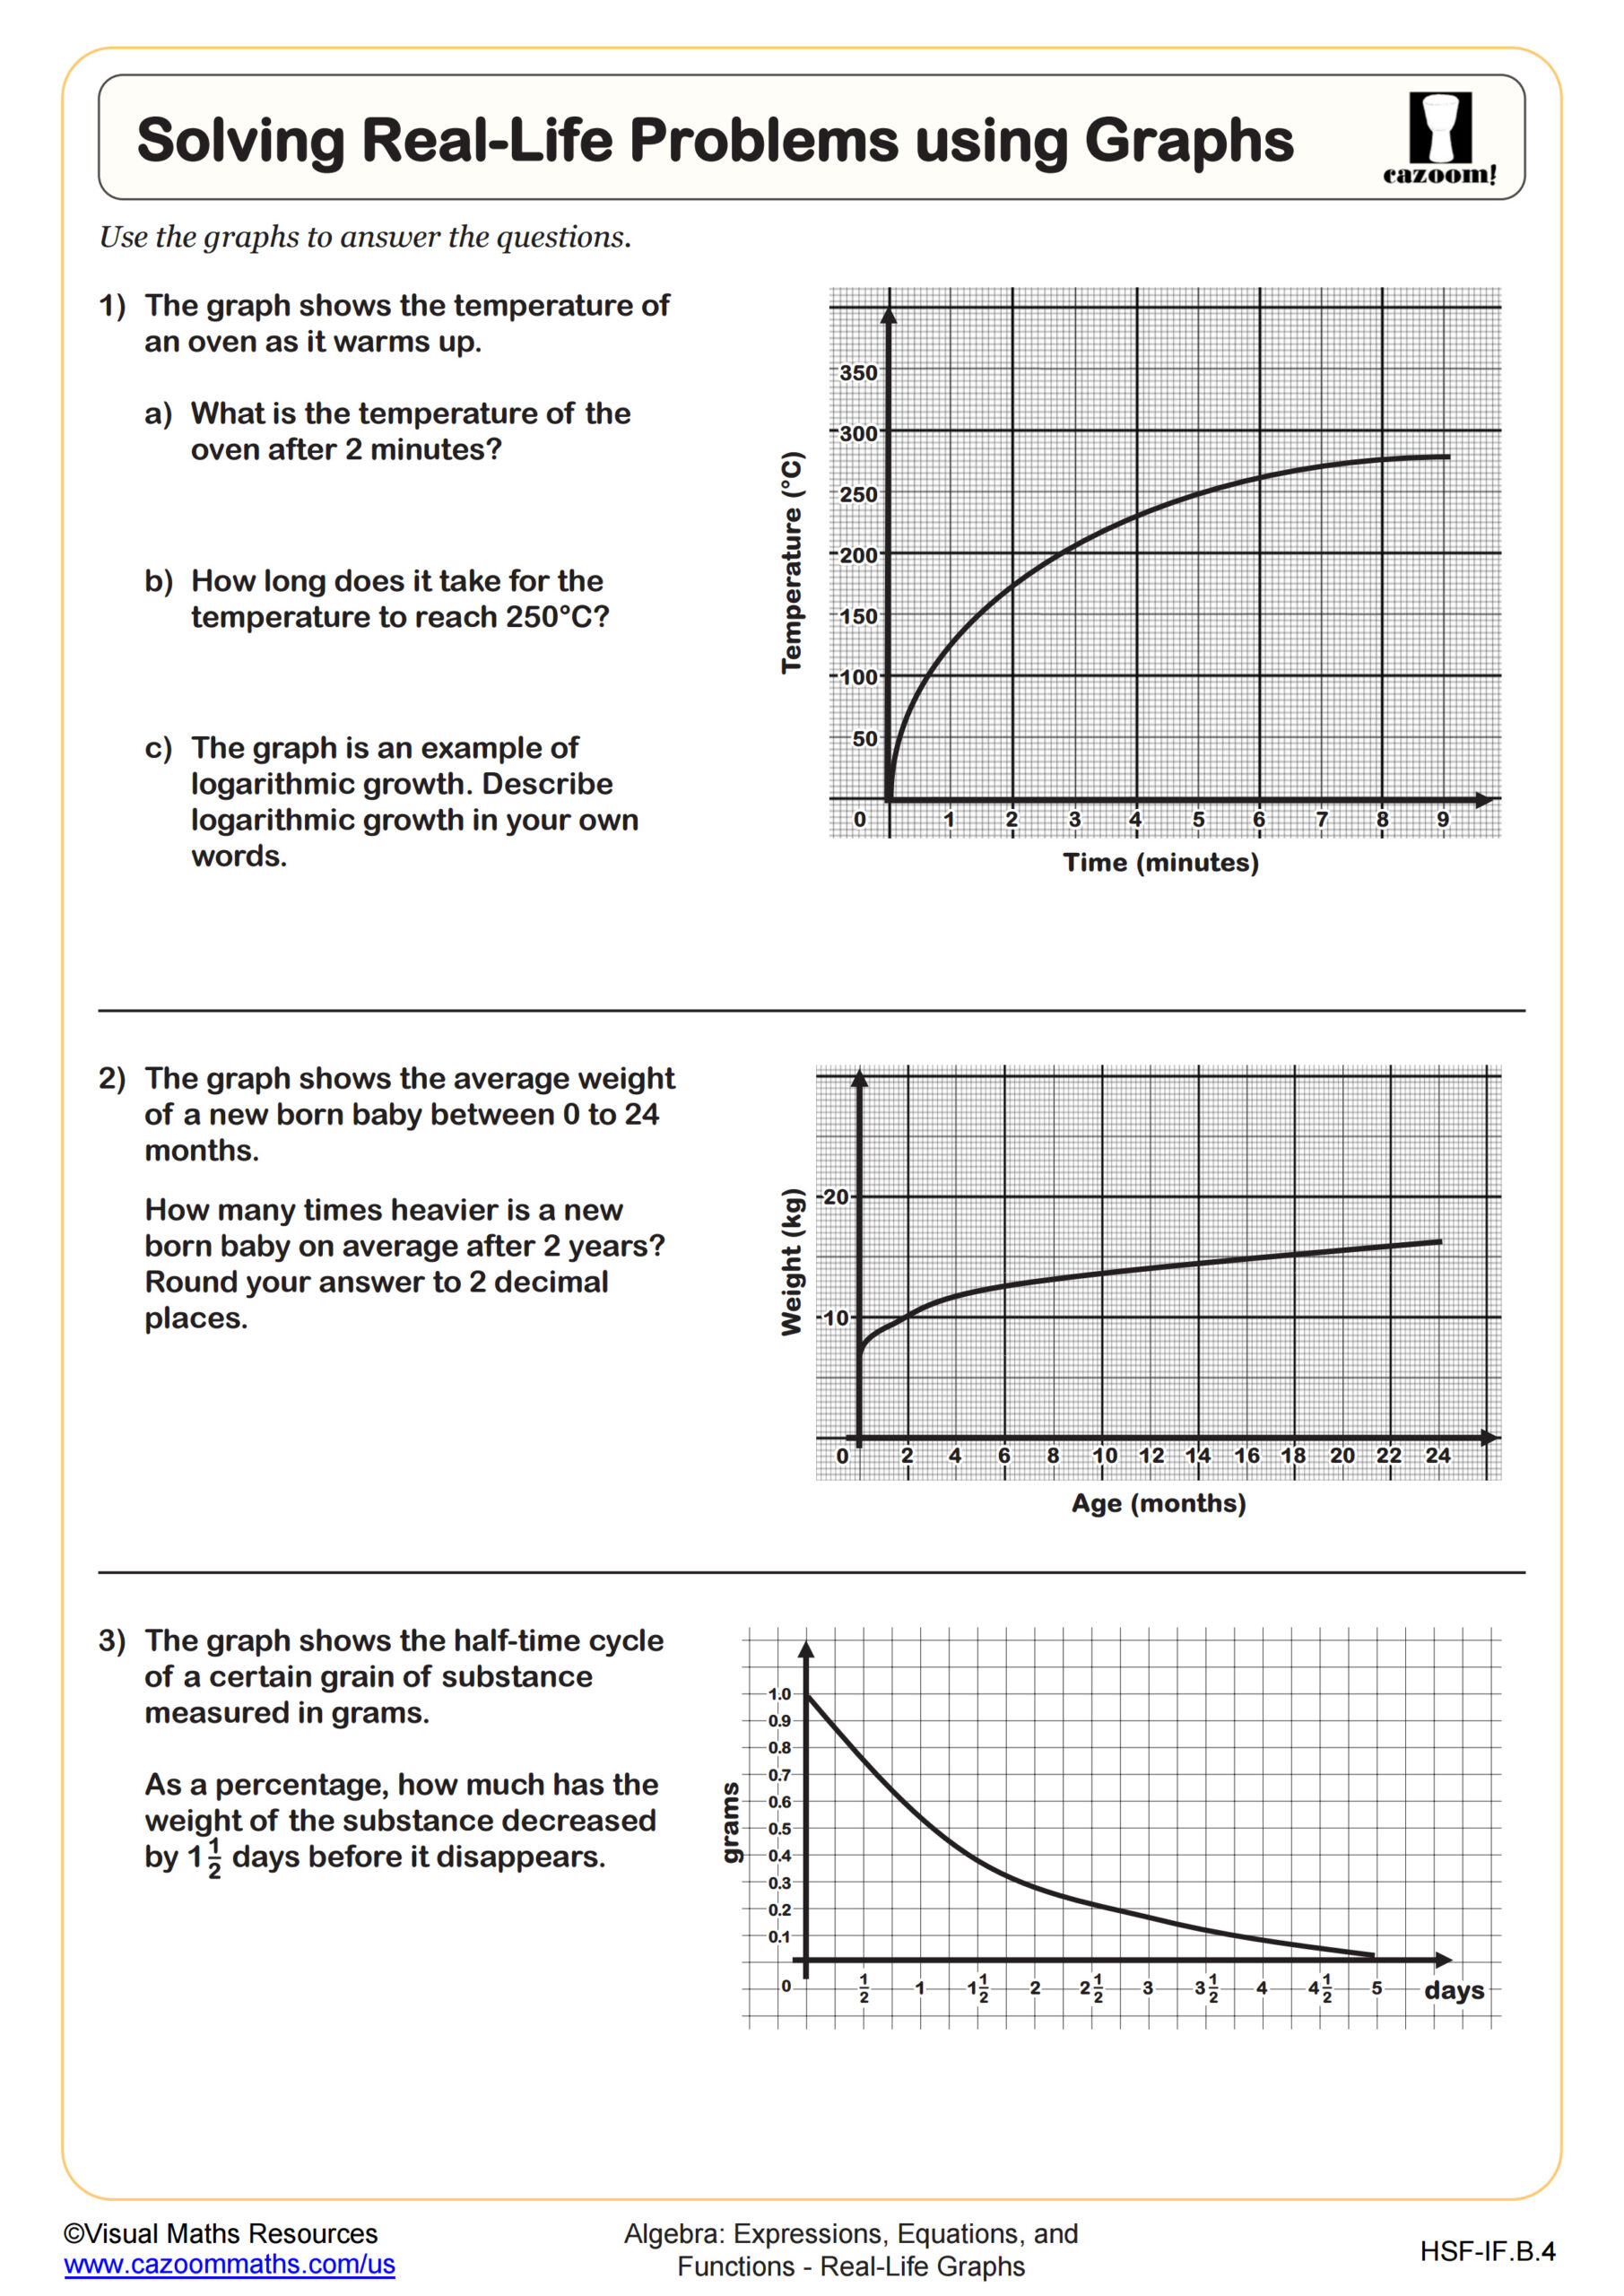
Solving Real-Life Problems using Graphs
Grades: Algebra I, IM 1
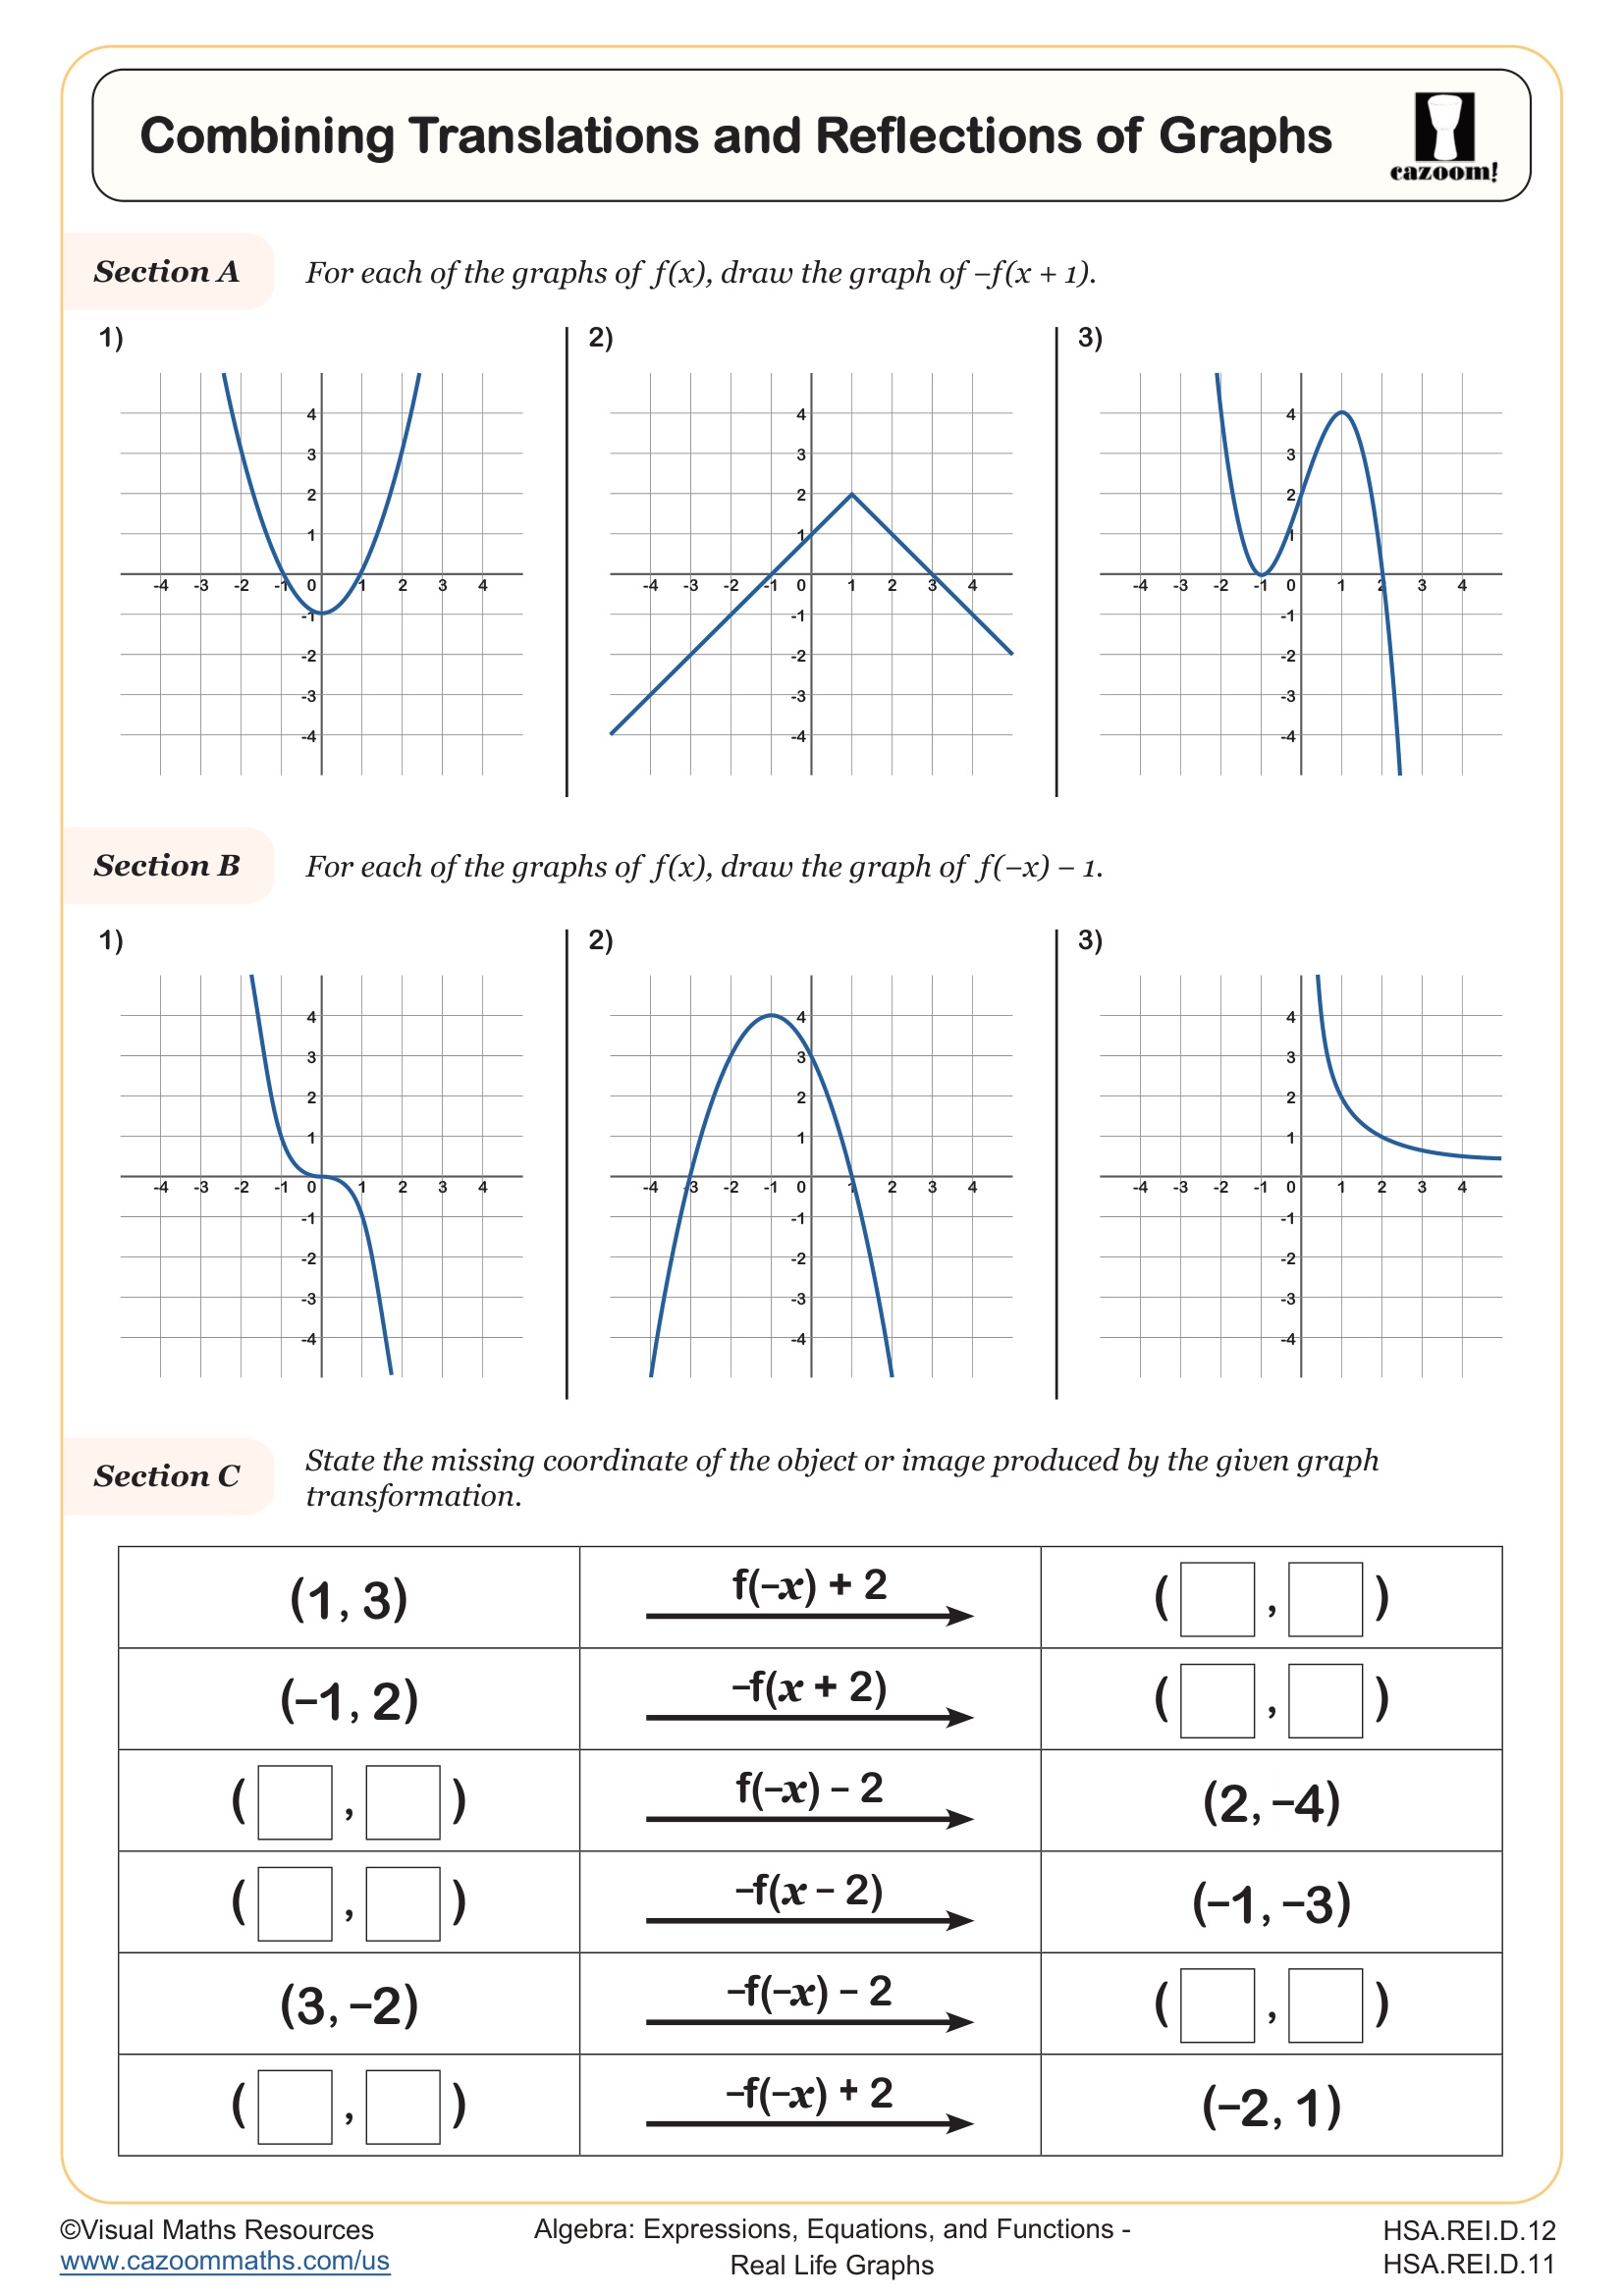
Combining Translations and Reflections of Graphs
Grades: Algebra II, IM 1
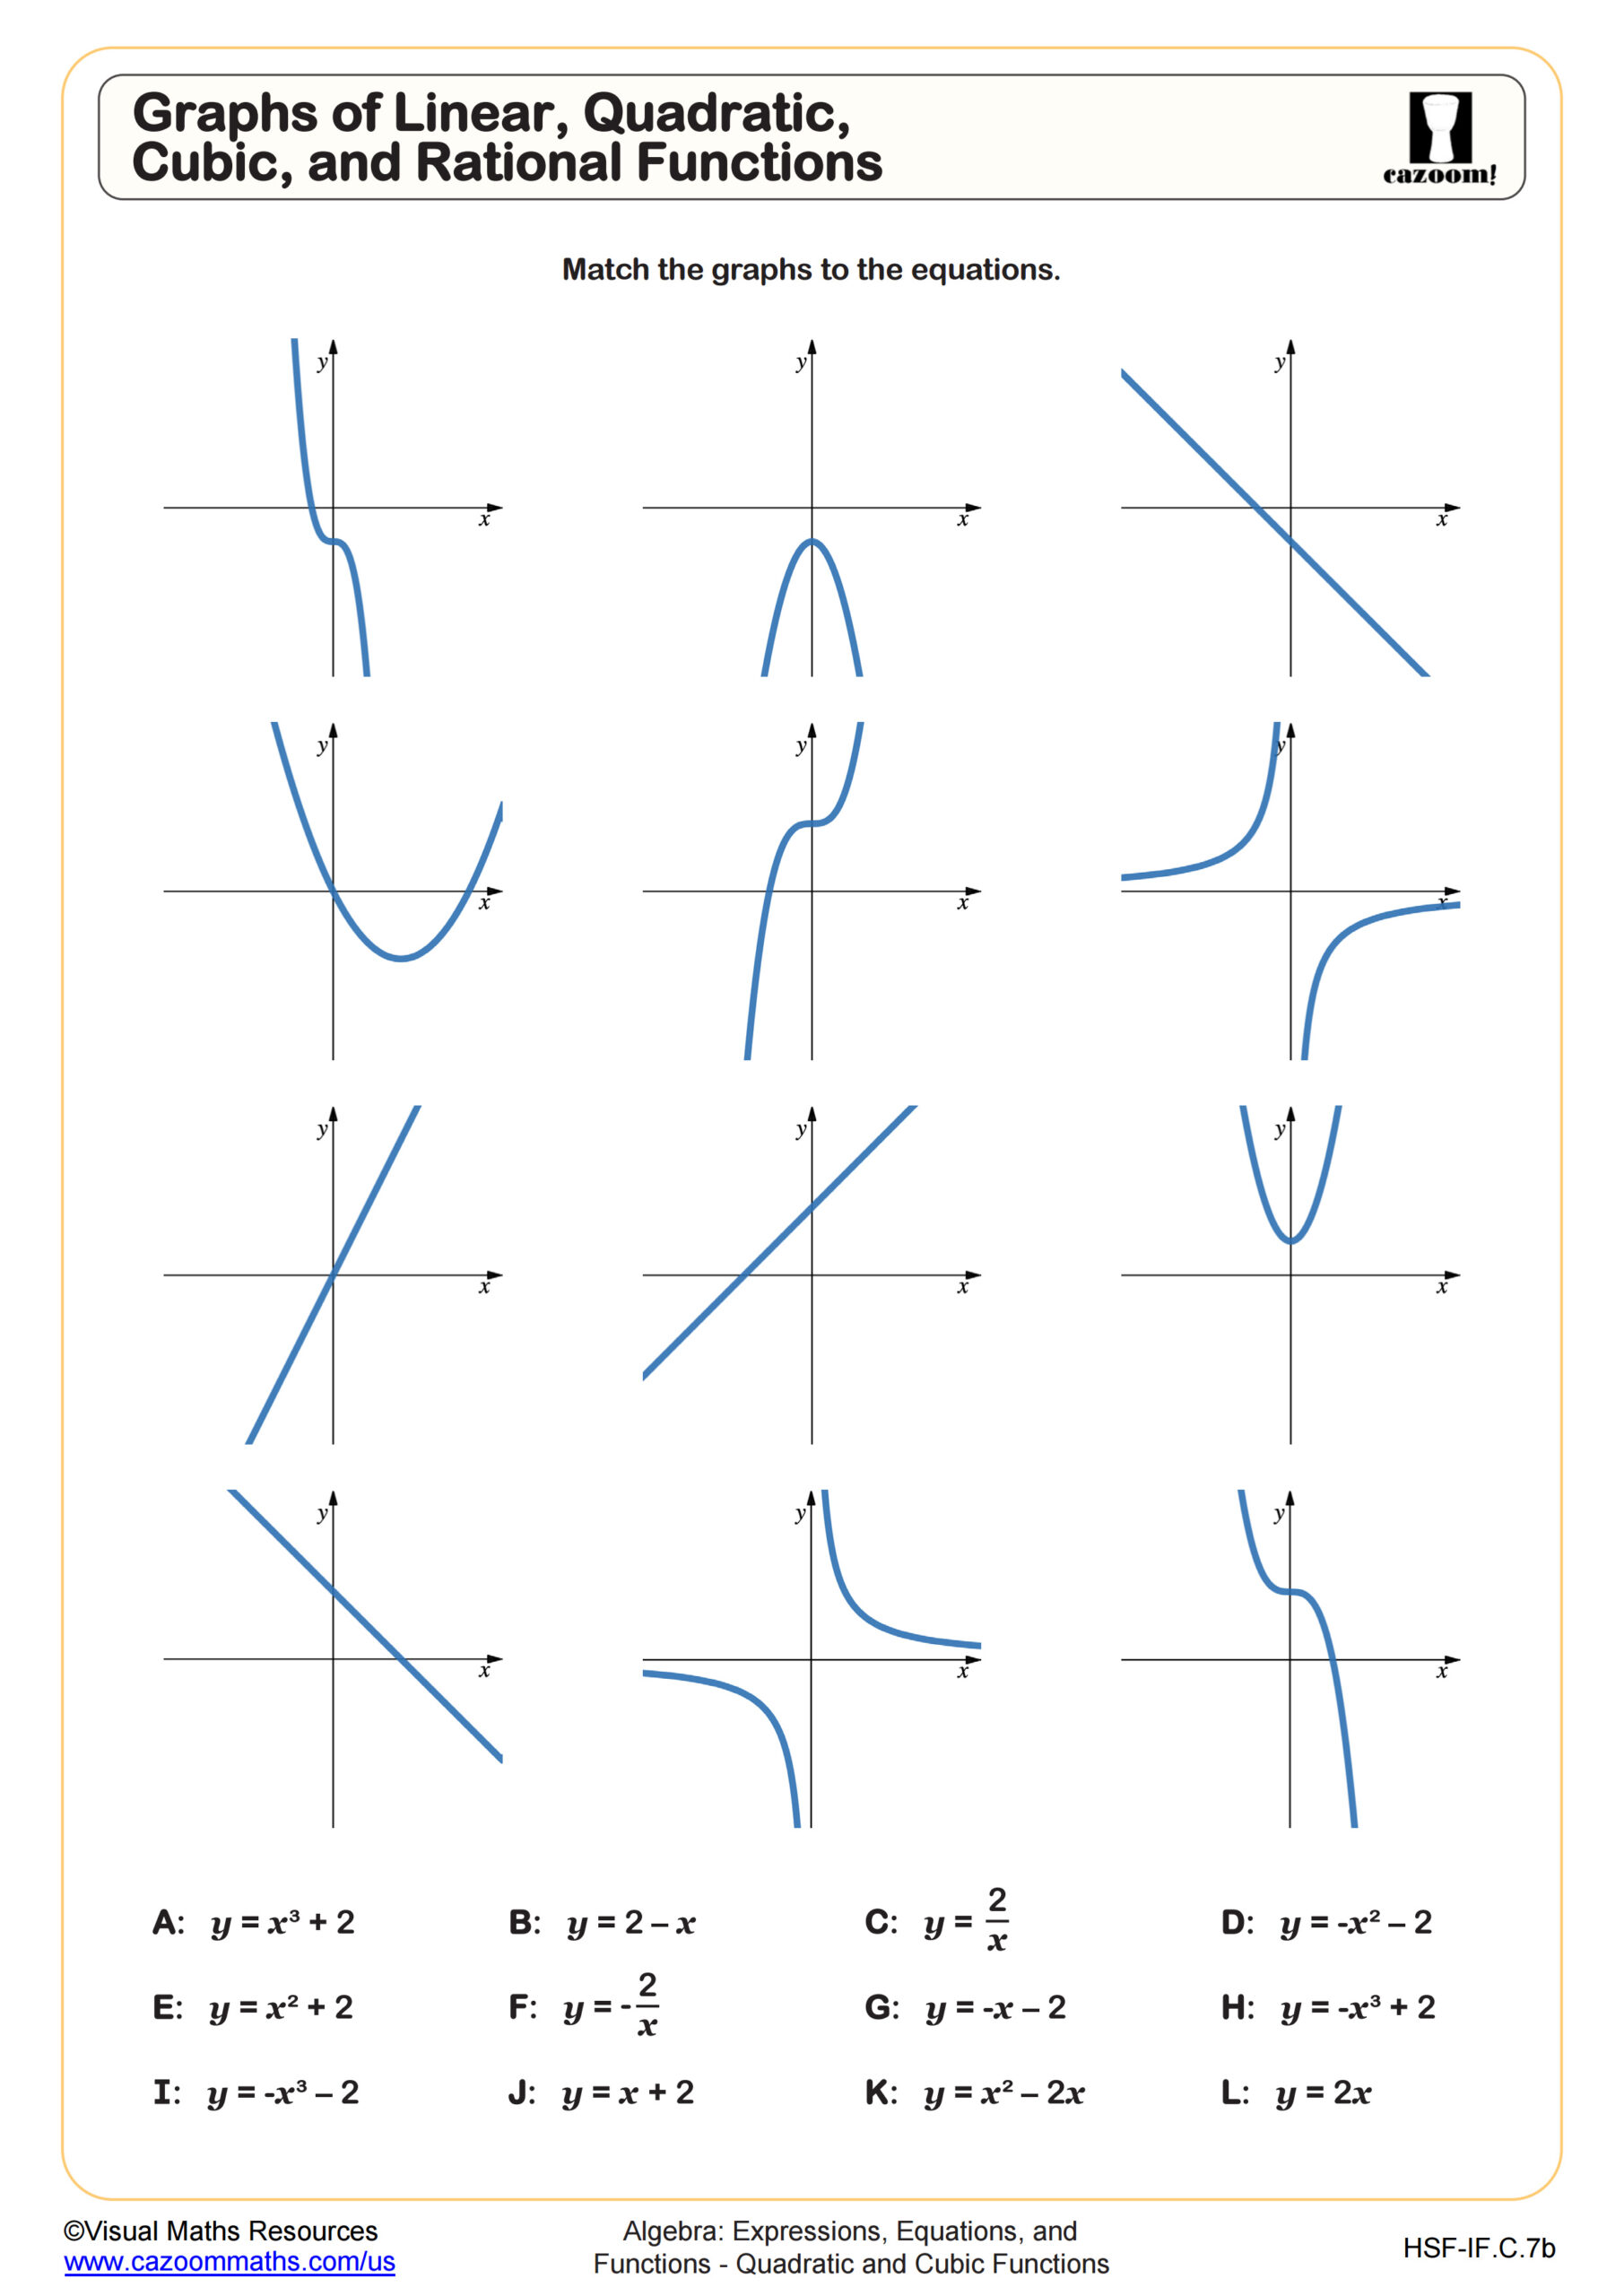
Graphs of Linear, Quadratic, Cubic, and Rational Functions
Grades: Algebra II, IM 3
Printable Speed, Distance & Time Graphs Worksheets With Answers
Our worksheets enable students to improve drawing and interpreting many types of real-life graphs. Distance time graphs and speed time graphs have real-world relevance, so students will use this information even beyond their time at school. At Cazoom our real-life graphs worksheets with answers present the information they need in a clear and engaging way and help them become more confident about real-life graphs.
THE IMPORTANCE OF DISTANCE AND TIME GRAPHS
Graphs are used across many different industries as a way to represent data in an easy to understand format.
A real-life graph is one that represents a real-world problem, such as measuring distance and speed against time. Knowing how to use and interpret these types of the graph is an invaluable skill which students will use time and time again throughout their life and future career. Graphs are a useful way of displaying large volumes of data, making analyzing data and drawing conclusions much easier. Although there are many computer applications that will create graphs automatically based on a data set, a competent human being is still needed to interpret the graph and explain the evidence, so the importance of learning about graphs in school should not be understated.
PRACTICE DRAWING AND INTERPRETING GRAPHS WITH WORKSHEETS
Graphs are useful not just as a visual representation of a set of data, but for helping consolidate students’ knowledge of gradients and linear functions.
Distance time graph will always be represented by a straight line showing a rate of change, meaning students can then work out the equation of the line and its gradient. Clearly presented real-life graphs worksheets help students master the skill of drawing and interpreting graphs. Math worksheets contain enjoyable activities that allow students to practice their knowledge of distance time graphs and have fun in the process.
Check our real-life graph worksheets and challenge your students with amazing distance time graphs and speed time graphs each differentiated and fun, with answer keys provided so you can follow their progress.