Comparing Two Sets of Data WORKSHEET
Use statistics appropriate to the shape of the data distribution to compare center (median, mean) and spread (interquartile range, standard deviation) of two or more different data sets.
Comparing Two Sets of Data WORKSHEET DESCRIPTION
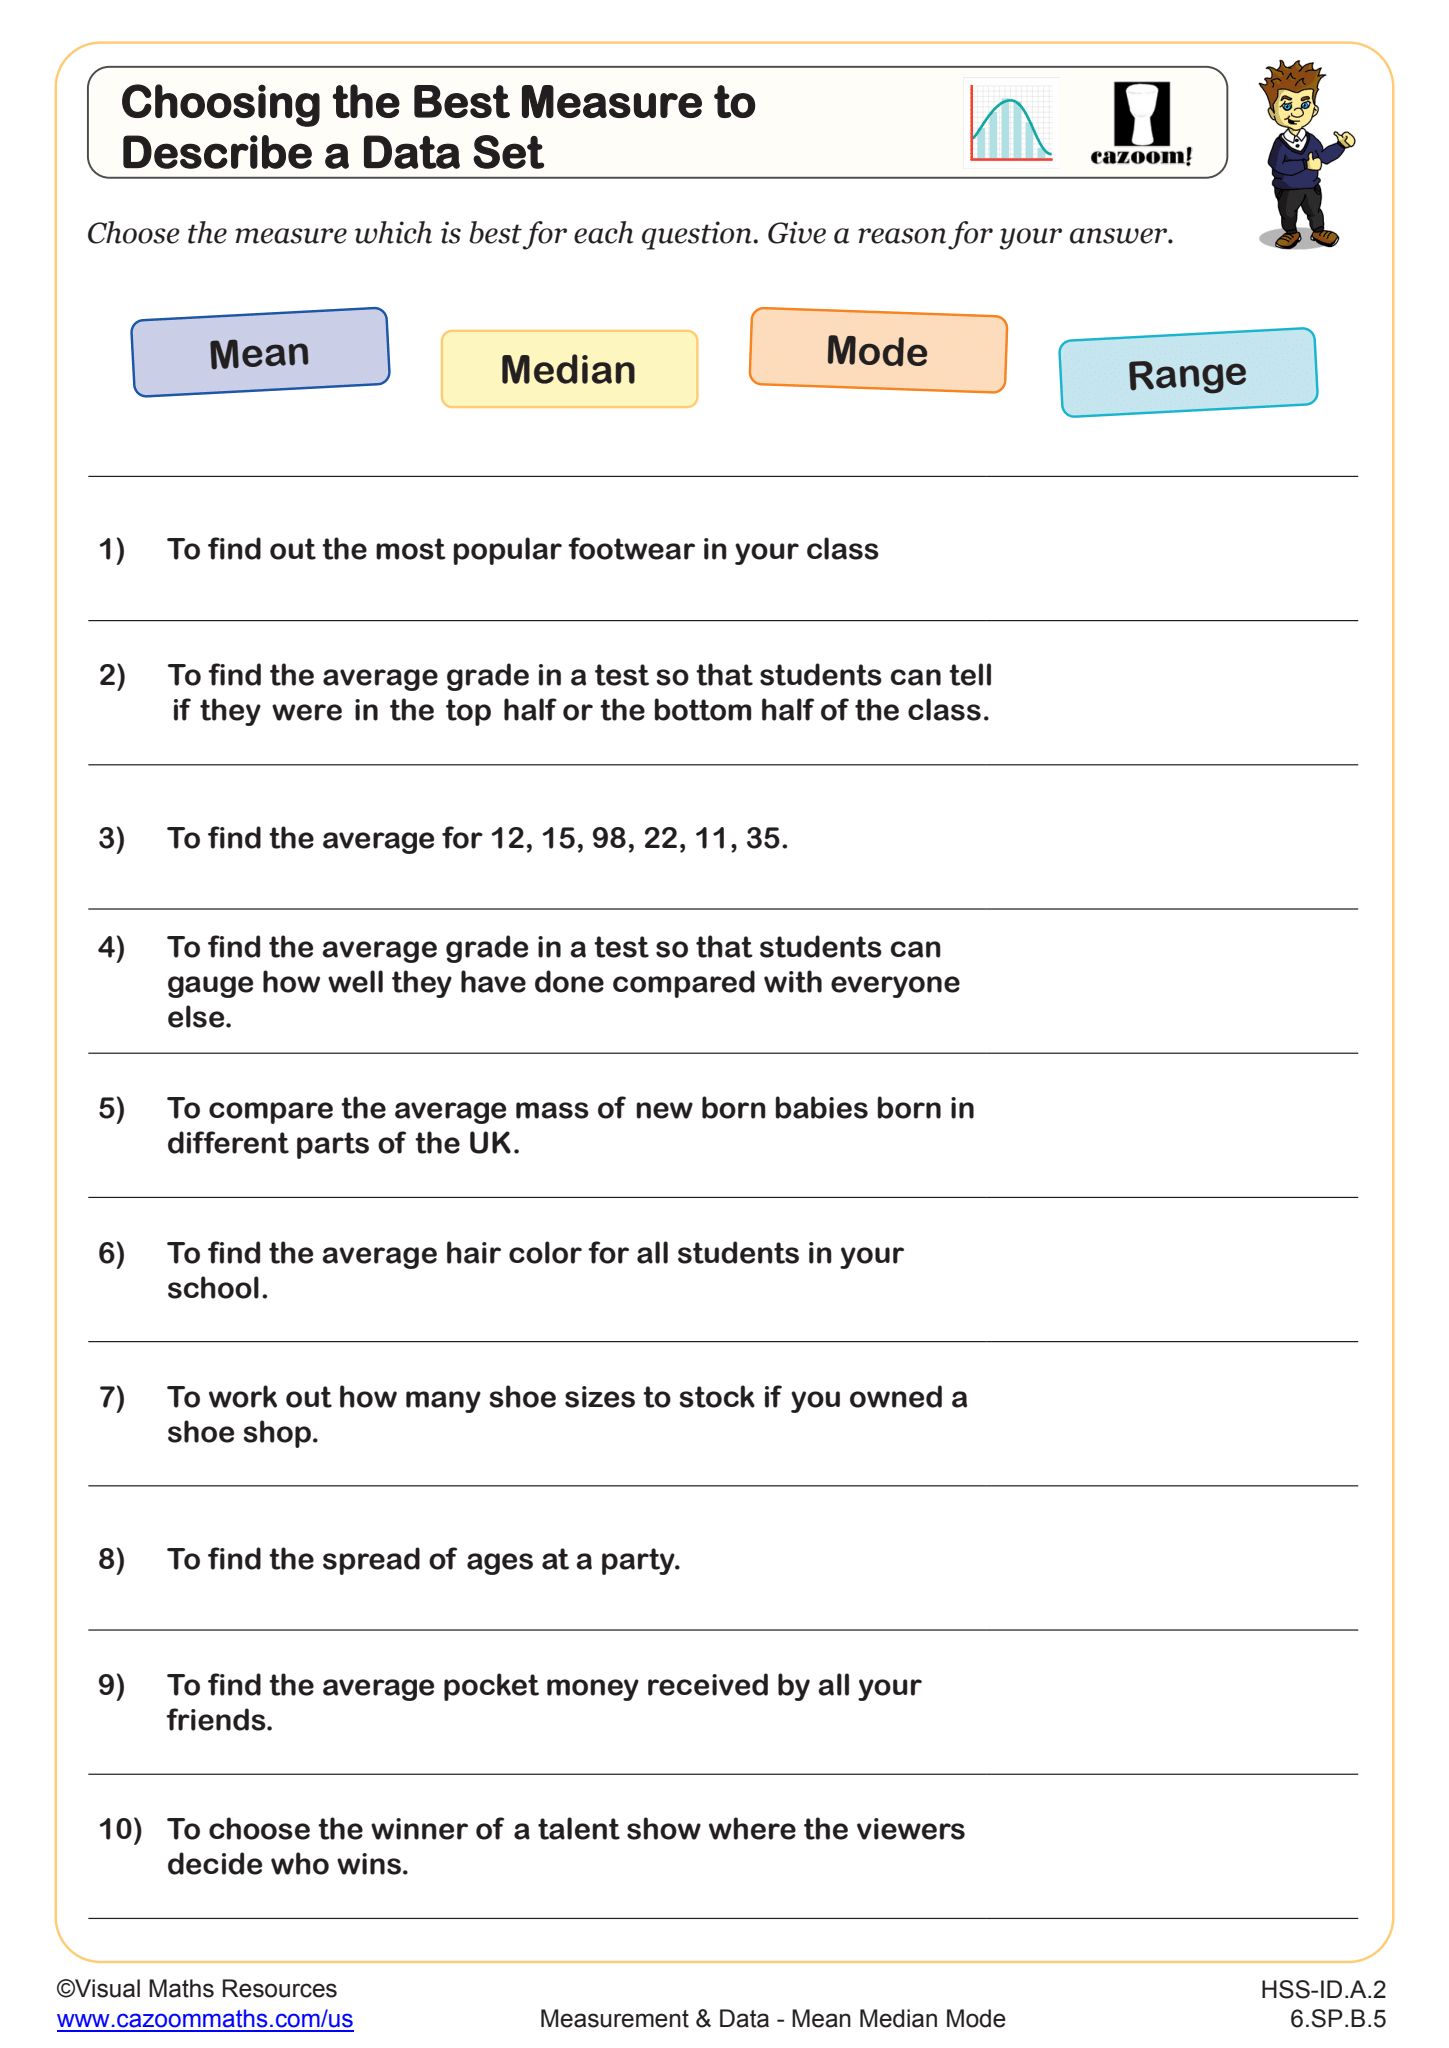
This worksheet provides an opportunity for learners to practice comparing two sets of data. Data is presented in the form of bar charts and frequency tables, and learners will need to think about averages and range to compare the data and answer the questions. The context of the data will be important to how the comparisons are used, for exmample, is a low mean better or a high mean better?
All worksheets are created by the team of experienced teachers at Cazoom Math.

RELATED TO Comparing Two Sets of Data WORKSHEET
Frequently Asked Questions
This worksheet on comparing two sets of data is designed for 6th Grade and Algebra I students. These grade levels are perfect for developing the analytical skills needed to interpret bar charts and frequency tables while working with statistical concepts like mean, median, and mode.