WORKSHEET OF THE WEEK
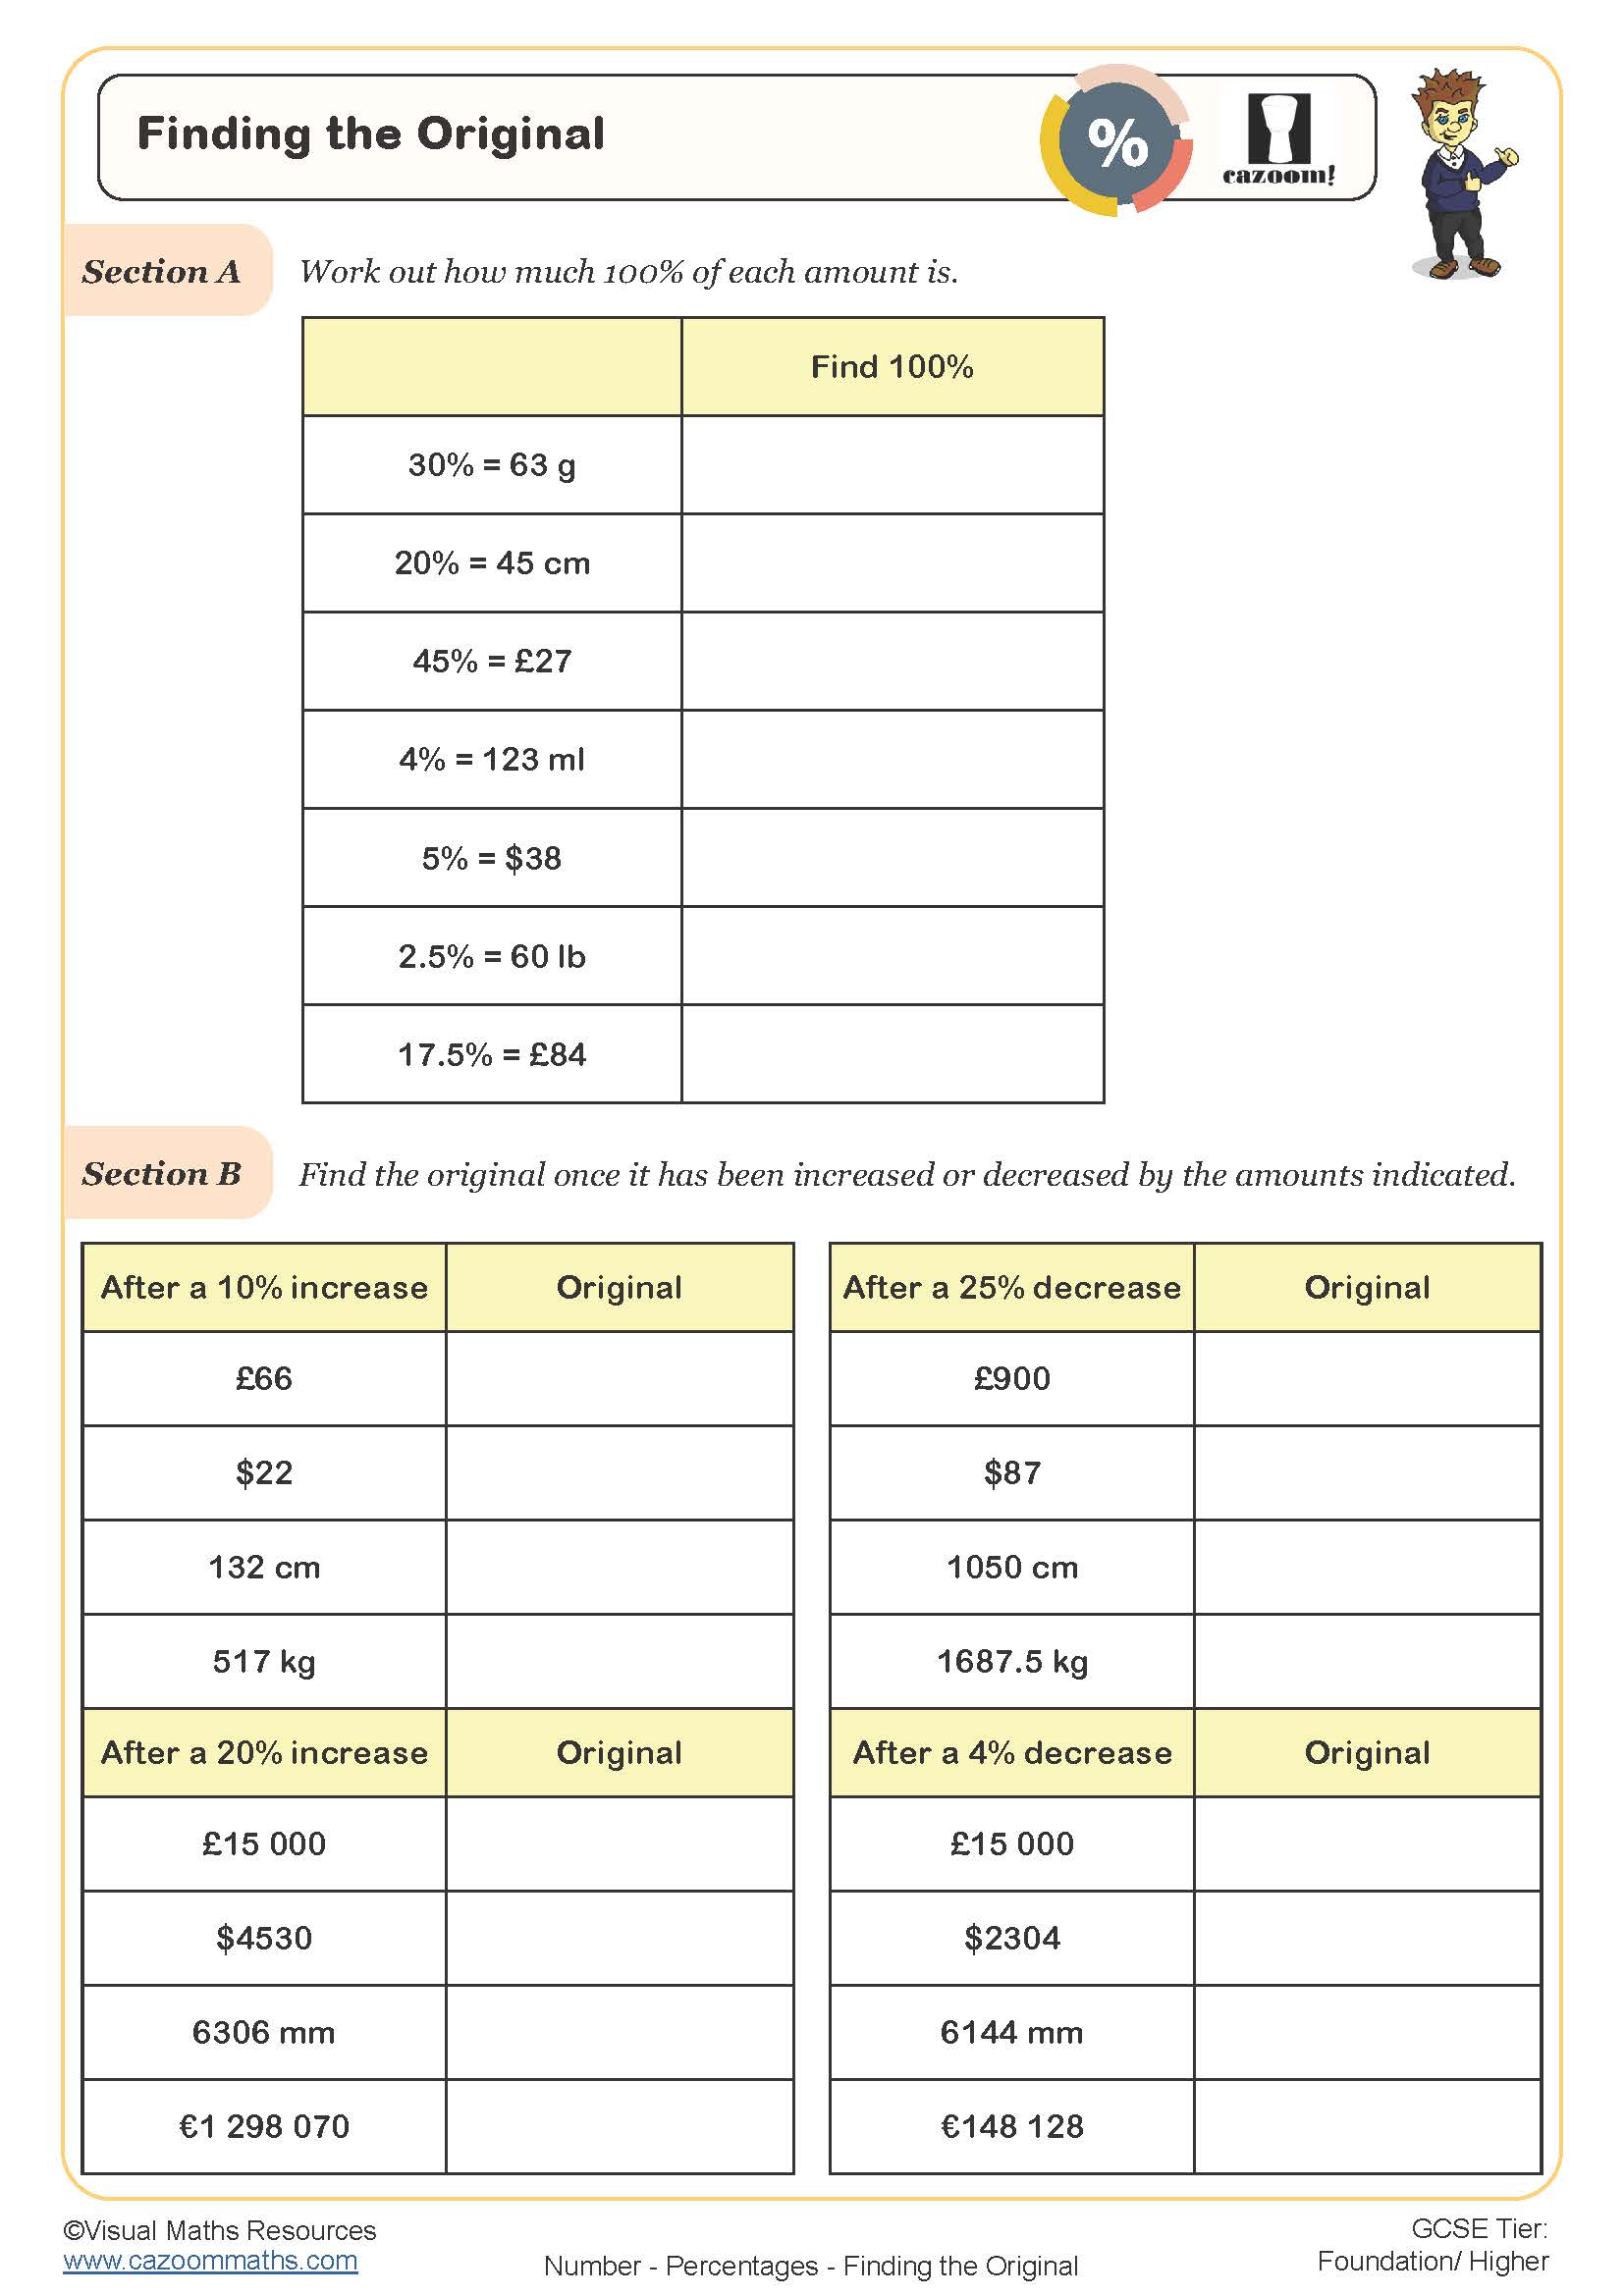
This week, I wanted to share a Percentages Resource suitable for your Year 9 and Year 10 students. This Finding the Original Worksheet provides excellent practice on Reverse Percentages through examination-style questions, helping students find 100% from given values and original amounts after percentage changes. The worksheet also includes contextual worded problems mixing increases and decreases in GCSE Mathematics exam style, ensuring comprehensive preparation.
DOWNLOAD THE WORKSHEET OF THE WEEK
Are You Ready to save hours of lesson planning time?
Then try a 7 day free trial of Cazoom Premium. Try our full range of resources out for 7 days and then pay just £4 a month (annual plan) for continued access.
With Premium Membership, you'll get access to everything else on our platform, including:
- A range of over 1,000 KS1 to KS4 Mathematics worksheets and resources.
- Uniquely designed, fun, and engaging worksheets.
- An ever-growing collection – new resources added regularly.
- Differentiated Lessons – every time. Guaranteed.
- Research-led proven strategies.
- Both UK and US Maths curriculums covered.
List of Topics
Our printable maths worksheets cover the full range of topics. See below the list of topics covered. All our maths worksheets can be accessed here.
Algebra
- BODMAS
- Expanding Brackets
- Factorising
- Indices
- Inequalities
- Linear Functions
- Real Life Graphs
- Rearranging Equations
- Sequences
- Simplification
- Solving Equations
- Substitution
Number
- Calculator Methods
- Decimals
- Fractions
- Fractions Decimals Percentages
- Mental Methods
- Negative Numbers
- Percentages
- Place Value
- Powers
- Proportion
- Ratio
- Rounding
- Time
- Types of Number
- Written Methods
Geometry
- 2D Shapes
- 3D Shapes
- Area and Perimeter
- Bearings Scale and Loci
- Circles
- Compound Measures
- Constructions
- Coordinates
- Lines and Angles
- Polygons
- Pythagoras
- Similarity and Congruence
- Transformations
- Volume and Surface Area
Statistics
- Histograms and Frequency Polygons
- Mean Median Mode
- Pie Charts and Bar Charts
- Probability
- Scatter Graphs
- Stem-and-Leaf Diagrams
- Two-Way Tables and Pictograms